

Question
- Quantify the amount short-term costs and benefits of running 10 Uncommon Values for Lehamn Brothers. Does the process create short-term financial value for the
-Quantify the amount short-term costs and benefits of running 10 Uncommon Values for Lehamn Brothers. Does the process create short-term financial value for the firm? What other intangible costs and benefits arise from the process?
-Does 10 Uncommon Values create value for Lehmans clients?
-Is there any evidence that specific features of the 10 Uncommon Values (e.g. the use of incentive compensation for analysts, committee size, management commitment to the process) have an impact on the committees performance?
CASE SUMMARY:
On April 30, 2004, Steve Hash, research director at Lehman Brothers, prepared to initiate the firms 10 Uncommon Values stock-picking process for the year. Each year for 54 years, Lehmans research department had identified 10 stocks that it expected to generate superior returns for investors in the succeeding 12 months. These stocks and an analysts summary report on each were published in a booklet entitled 10 Uncommon Values. The performance of the stocks selected for 10 Uncommon Values had historically been stronga portfolio that acquired the recommended stocks and held them for one year would have outperformed the Standard & Poors (S&P) 500 in 39 of the preceding 54 years. But between 2000 and 2002 the recommendations had performed poorly, generating an average return of 22.5% versus the S&P 500s 11.7% return. The process of picking stocks for 10 Uncommon Values began with each analyst selecting one stock among those he or she covered. An investment committee then selected the 10 best bets among analysts recommendations. Changes had been made over the years. The size of the investment committee had fluctuated from as many as nine members to as few as three. The selection process had also changed: the amount of time devoted to reviewing analysts recommendations had ranged from as long as 30 minutes per analyst to as little as 10 minutes. Finally, the ramifications for analysts whose recommendations were selected had changed. Between 1988 and 1993 they had been awarded cash bonuses, but since 1994 there had been no direct remuneration. Hash wondered how these changes had affected the integrity and effectiveness of the selection process, particularly in light of the lists recent subpar performance. Additional research was needed, he decided, before settling on the methodology to be used by the 2004 committee.
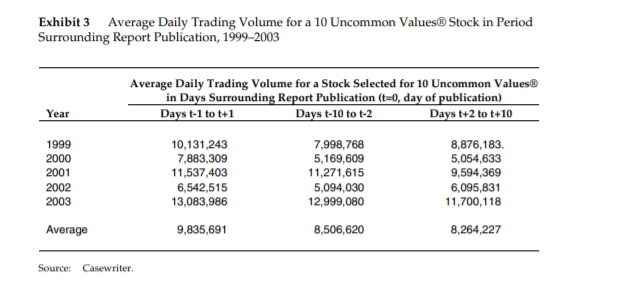
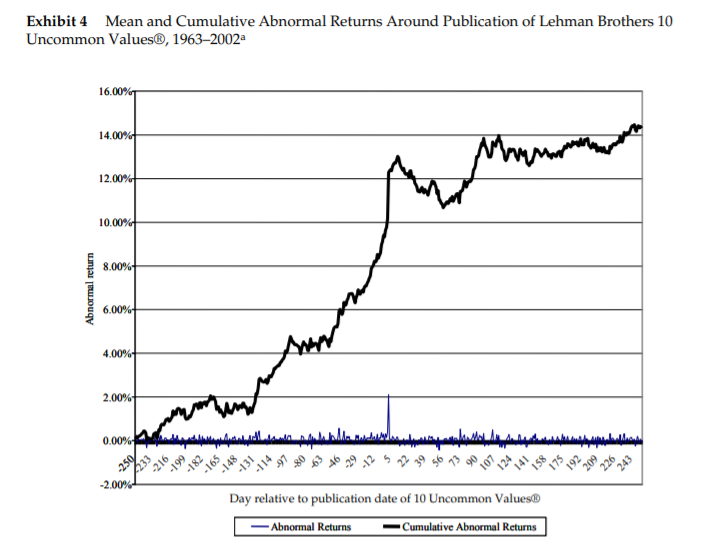
-Lehman Brothers emphasized equity research as a means of providing value for its clients and shareholders, and in 1949 was the first firm to create a top-10 stock list. According to Jack Rivkin, a former global head of research, the top-10 list was created primarily to increase demand for the firms brokerage services. The reason it was done in July, in the middle of the summer, was because July is typically a dead period for the brokers, Rivkin explained. So someone decided, Lets figure out what we can do during the summer doldrums to generate some business. As Exhibit 3 shows, 10 Uncommon Values generally succeeded in increasing trading volume in the recommended stocks around the time of the reports publication. Over the years, 10 Uncommon Values developed a reputation for adding value to Lehman Brothers clients. On average, during the year following publication of each 10 Uncommon Values report, the selected stocks earned 14.2%, versus only 8.1% for the S&P 500 Index. Of the 10 stocks, 6.6 appreciated in value and 3.4 declined. Adjusted for risk, the recommended stocks enjoyed average abnormal returns in the year subsequent to selection of 6.2%. However, as Exhibit 4 illustrates, much of this return was realized on the date the report was published.
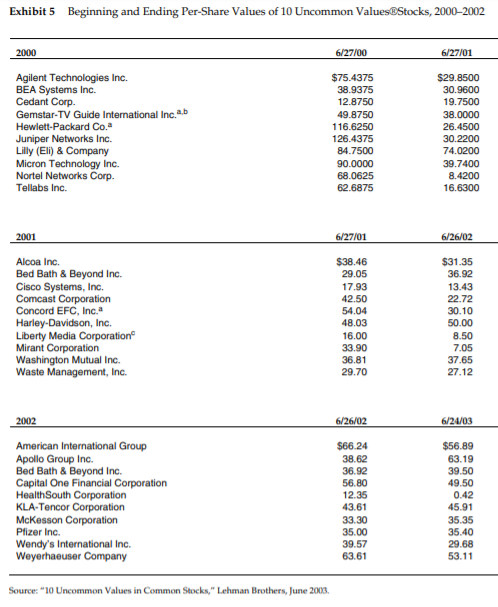
-Each analyst prepared a written report on his or her stock recommendation. This report consisted of the investment thesis, its rationale, risk and valuation analysis, and conclusions. It also included descriptions of the companys products and cost structure, the sectors outlook (growth, competitive threats), earnings models, valuation comparisons, and the companys historical stock performance versus the S&P 500 Index. All analysts used the same template. The reports on the selected stocks were later published. (See Exhibit 5 for a list of 10 Uncommon Values stocks selected between 2000 and 2002 and Exhibit 6 for a sample report.) The IPC then reviewed the analysts reports and met with each analyst to review his or her idea and to test its merits by challenging its underlying assumptions. After full consideration, each member votes for what he or she considers the 10 best investment ideas for the coming year. The votes are equally weighed; those common stocks with the most votes are the ones that make up the 10 Uncommon Values portfolio.
-The final list of recommendations was published at the end of June; the investment cycle began on July 1 and ended on June 30 of the following year. The selected stocks remained in the 10 Uncommon Values portfolio for the rest of the year regardless of subsequent developments. In tracking performance, Lehman assumed that an equal-weighted portfolio of the 10 stocks was acquired on July 1 and held for one year
Variations in the Stock-Selection Process:
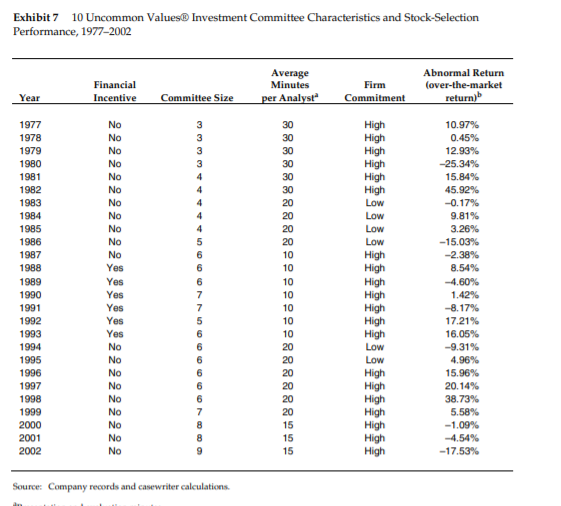
-Fluctuations in Committee Size :The size of the investment committee fluctuated between three and nine members between 1977 and 2002. (See Exhibit 7 for committee characteristics and stock-selection performance in those years.) In general, committee size increased over time. The committee grew fastest in the late 1990s, from six members in 1998 to seven in 1999, eight in 2000, and nine in 2002.
-Variation in Committee Composition: The composition and aggregate experience of the committee also varied over the years. In some years the committee was composed exclusively of members of the research department. At other times, representatives of other departments were added to diversify the group: participants had included the chief U.S. strategist, the director and/or associate director of U.S. equity research, the head of U.S. equity product management, the core equity portfolio manager for Lehman Brothers Bank, the head of institutional sales, and the head of trading. Murphy explained that diversity generated fresh perspectives in the questions raised during the review process. The participation of such senior-level personnel represented a significant financial investment on the part of Lehman Brothers. The time commitment of each committee member was estimated at 30 35 hours per year, and their time was highly valued. The director of research earned around $2 million, and other senior managers earned between $900,000 and $1.7 million. An average analyst made about $600,000 a year.
-Variation in the Decision-Making Process: Insiders described three distinct decision-making processes. In one version, committee members listened to all the analysts presentations without deliberating until the committees final meeting in June. At that meeting, the members reviewed their notes from analysts presentations, debated the merits of each, and identified the top 10. In the second method the committee deliberated briefly after each analysts presentation, immediately eliminating some stocks from consideration. In June the committee met again to choose the best 10 from the 2025 surviving stocks. The third method involved two rounds of selection. During the lightning round, analysts presented ten-minute elevator pitches. The committee chose 20 stocks, whose sponsor analysts were invited to make longer presentations; the committee then made its final decision.
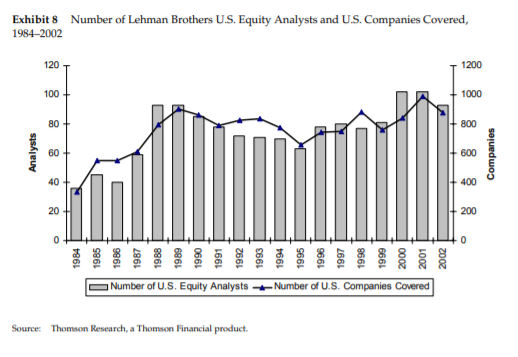
-Variation in Time Invested: As the number of research analysts grew, the IPC had to meet with more analysts each year. (See Exhibit 8 for the tally of Lehman Brothers U.S. equity analysts and U.S. companies covered in the period 19842002.) The pressure of time forced the committee to allocate less time to each analyst. In 2003, the IPC devoted about 15 minutes to each analyst, including deliberations. It was suggested that the committee begin meeting in March rather than April. But doing so would require that the researchers analyses cover a longer period: rather than forecasting the stocks performance over 12 months, they would need to generate analyses for 1516 months.
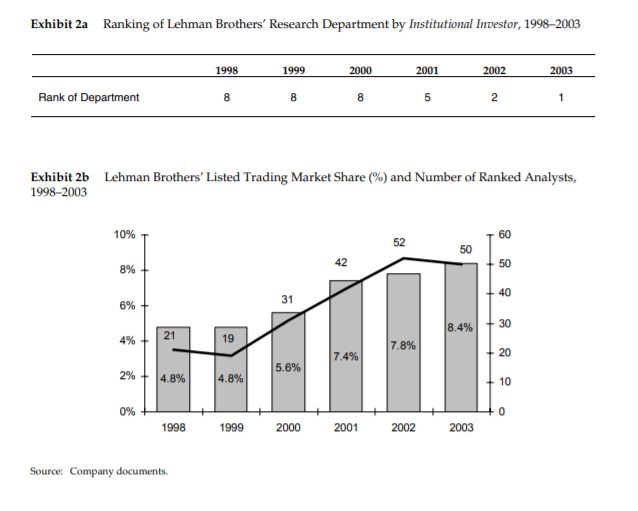
-Variation in Commitment Changes in top managements commitment to 10 Uncommon Values have coincided with changes in research directors. From 1977 to 1982, managements commitment to research, and to the 10 Uncommon Values process, was high. Lehmans acquisition by American Express in 1983 caused turmoil in the research department of the merged company, and commitment to the screening process suffered. From 1987 to 1992, however, when Jack Rivkin was head of research and then head of equity, the stock-selection process was closely scrutinized. Paul Williams, who replaced Rivkin, had no equity experience and put little emphasis on 10 Uncommon Values. Following its spinoff from American Express in 1994, Lehman pursued firmwide cost-cutting, causing high turnover among equity analysts. Over a 15-month period, 30 of 72 equity analysts departed, along with the heads of global equity research and U.S. equity research. For two years, the 10 Uncommon Values process was not a priority. But in 1996, Lehman decided to rebuild its research department. In 1997 Joe Gregory and Steve Hash, global and U.S research heads respectively, were given a mandate to make the equity research department the best on Wall Street. Over the ensuing six years, they placed strong emphasis on 10 Uncommon Values. We really did the process with a lot of rigor. First, we tried to eliminate the worst ideas, Hash remarked. After that, coming up with the best 10 ideas was easier.
-Variation in Analyst Rewards: Between 1988 and 1993, Lehman Brothers rewarded analysts whose recommendations were selected. Steve Balog described the compensation: You got a special bonus if you had a stock get into the 10 Uncommon Values and a smaller bonus for the five silver-medalist names. The amount was significant, perhaps 510% of ones total compensation. It wasnt gonna allow you to retire but it could get you a good chunk of a Lexus. The amount felt like enough to get broad participationallow greed to overcome the fear that ones idea torpedoes that years list and you would be the department goat. Analysts whose stocks were selected typically received cash bonuses of about $50,000 in the early 1990s. The five silver medalists, or runners-up, received about $25,000 each. Financial awards were discontinued in 1994, but many in the firm believe that analysts have continued to take the process seriously. It became its own folklorethey wanted to be on the list, one committee member explained. They would come back and be upset if the stocks werent on the list.
-Variation in the Committee Voting Process: The investment committees voting process also varied slightly over the years. Some years committee members voted by secret ballot, and the stocks that received the most votes were automatically selected. Other years voting was transparent, and members often debated the two or three stocks that made it into the top 10 by the narrowest margins to make sure that the last two to three seeds went to deserving stocks. In most years, the committee members publicly voted for their best 10 stocks.
-
Exhibit 1 Average Commission per Share (in cents), 1997-2002 1977 1978 1979 1980 1981 1982 1983 1984 1985 1986 1987 1988 1989 1990 1991 1992 1993 1994 1995 1996 1997 1998 1999 2000 2002 Year Source: Compiled from Greenwich Associates, "Commission Rates and Concentration of Business," 1977-2002 Exhibit 2a Ranking of Lehman Brothers' Research Department by Institutional Investor, 19982003 1998 8 1999 8 2000 8 2001 5 2002 2 2003 1 Rank of Department Exhibit 2b 1998-2003 Lehman Brothers' Listed Trading Market Share (%) and Number of Ranked Analysts, 52 50 12 31 21 7.8% 5.6% 4.8% 4.8% 0% + 1998 1999 2000 2001 2002 2003 Source: Company documents. Exhibit 3 Average Daily Trading Volume for a 10 Uncommon Values Stock in Period Surrounding Report Publication, 1999-2003 Average Daily Trading Volume for a Stock Selected for 10 Uncommon Values in Days Surrounding Report Publication (0, day of publication) Days t-1 to t+1 Days t-10 to t-2 Days t+2 to t+10 Year 1999 2000 2001 2002 2003 10,131,243 7,883,309 11,537,403 6,542,515 13,083,986 7,998,768 5,169,609 11,271,615 5,094,030 12,999,080 8,876,183 5,054,633 9,594,369 6,095,831 11,700,118 Average 9,835,691 8,506,620 8,264,227 Source: Casewriter. Exhibit 4 Mean and Cumulative Abnormal Returns Around Publication of Lehman Brothers 10 Uncommon Values, 1963-2002a 16.00% 14.00% 12.00% 10.00% Abnormal return 500% 4.00% 2.00% 0.00% .. 05469 ... .. 63 x 225 65 o .. 50 pm -2.00% Day relative to publication date of 10 Uncommon Values -Abnormal Returns Cumulative Abnormal Returns Exhibit 5 Beginning and Ending Per-Share Values of 10 Uncommon Values Stocks, 2000-2002 2000 6/27/00 6/27/01 Agilent Technologies Inc. BEA Systems Inc. Cedant Corp Gemstar-TV Guide International Inc. a.b Hewlett-Packard Co. Juniper Networks Inc. Lilly (Eli) & Company Micron Technology Inc. Nortel Networks Corp. Tellabs Inc. $75.4375 38.9375 12.8750 49.8750 116.6250 126.4375 84.7500 90.0000 68.0625 62.6875 $29.8500 30.9600 19.7500 38.0000 26.4500 30.2200 74.0200 39.7400 8.4200 16.6300 2001 6/27/01 6/26/02 Alcoa Inc. Bed Bath & Beyond Inc. Cisco Systems, Inc. Comcast Corporation Concord EFC, Inc. Harley-Davidson, Inc. Liberty Media Corporation Mirant Corporation Washington Mutual Inc. Waste Management, Inc. $38.46 29.05 17.93 42.50 54.04 48.03 16.00 33.90 36.81 29.70 $31.35 36.92 13.43 22.72 30.10 50.00 8.50 7.05 37.65 27.12 2002 6/26/02 6/24/03 American International Group Apollo Group Inc. Bed Bath & Beyond Inc. Capital One Financial Corporation Health South Corporation KLA-Tencor Corporation McKesson Corporation Pfizer Inc. Wendy's International Inc. Weyerhaeuser Company $66.24 38.62 36.92 56.80 12.35 43.61 33.30 35.00 $56.89 63.19 39.50 49.50 0.42 45.91 35.35 35.40 29.68 53.11 998 Source: "10 Uncommon Values in Common Stocks," Lehman Brothers, June 2003. Investment Committee Characteristics and Stock-Selection Exhibit 7 10 Uncommon Values Performance, 1977-2002 Financial Incentive Average Minutes per Analyst Firm Commitment Abnormal Return Cover-the-market return) Year Committee Size No No No High High High High High High Low Low No No Yes 1977 1978 1979 1980 1981 1982 1983 1984 1985 1986 1987 1988 1989 1990 1991 1992 1993 1994 1995 1996 1997 1998 1999 2000 2001 2002 Yes Yes MMMMOOOOOOOOOOO 10.97% 0.45% 12.93% -25.34% 15.84% 45.92% -0.17% 9.81% 3.26% -15.03% -2.38% 8.54% -4.60% 1.42% -8.17% 17.21% 16.05% -9.31% 4.96% 15.96% 20.14% 38.73% 5.58% -1.09% -4.54% -17.53% Yes Yes Low Low High High High High High High High Low Low High High High High High High Yes High Source Company records and can writer calculations Exhibit 8 Number of Lehman Brothers U.S. Equity Analysts and U.S. Companies Covered, 1984-2002 T 1200 A Analysts Companies D Number of U.S. Equity Analysts Number of U.S. Companies Covered Source Thomson Research, a Thomson Financial product. Exhibit 1 Average Commission per Share (in cents), 1997-2002 1977 1978 1979 1980 1981 1982 1983 1984 1985 1986 1987 1988 1989 1990 1991 1992 1993 1994 1995 1996 1997 1998 1999 2000 2002 Year Source: Compiled from Greenwich Associates, "Commission Rates and Concentration of Business," 1977-2002 Exhibit 2a Ranking of Lehman Brothers' Research Department by Institutional Investor, 19982003 1998 8 1999 8 2000 8 2001 5 2002 2 2003 1 Rank of Department Exhibit 2b 1998-2003 Lehman Brothers' Listed Trading Market Share (%) and Number of Ranked Analysts, 52 50 12 31 21 7.8% 5.6% 4.8% 4.8% 0% + 1998 1999 2000 2001 2002 2003 Source: Company documents. Exhibit 3 Average Daily Trading Volume for a 10 Uncommon Values Stock in Period Surrounding Report Publication, 1999-2003 Average Daily Trading Volume for a Stock Selected for 10 Uncommon Values in Days Surrounding Report Publication (0, day of publication) Days t-1 to t+1 Days t-10 to t-2 Days t+2 to t+10 Year 1999 2000 2001 2002 2003 10,131,243 7,883,309 11,537,403 6,542,515 13,083,986 7,998,768 5,169,609 11,271,615 5,094,030 12,999,080 8,876,183 5,054,633 9,594,369 6,095,831 11,700,118 Average 9,835,691 8,506,620 8,264,227 Source: Casewriter. Exhibit 4 Mean and Cumulative Abnormal Returns Around Publication of Lehman Brothers 10 Uncommon Values, 1963-2002a 16.00% 14.00% 12.00% 10.00% Abnormal return 500% 4.00% 2.00% 0.00% .. 05469 ... .. 63 x 225 65 o .. 50 pm -2.00% Day relative to publication date of 10 Uncommon Values -Abnormal Returns Cumulative Abnormal Returns Exhibit 5 Beginning and Ending Per-Share Values of 10 Uncommon Values Stocks, 2000-2002 2000 6/27/00 6/27/01 Agilent Technologies Inc. BEA Systems Inc. Cedant Corp Gemstar-TV Guide International Inc. a.b Hewlett-Packard Co. Juniper Networks Inc. Lilly (Eli) & Company Micron Technology Inc. Nortel Networks Corp. Tellabs Inc. $75.4375 38.9375 12.8750 49.8750 116.6250 126.4375 84.7500 90.0000 68.0625 62.6875 $29.8500 30.9600 19.7500 38.0000 26.4500 30.2200 74.0200 39.7400 8.4200 16.6300 2001 6/27/01 6/26/02 Alcoa Inc. Bed Bath & Beyond Inc. Cisco Systems, Inc. Comcast Corporation Concord EFC, Inc. Harley-Davidson, Inc. Liberty Media Corporation Mirant Corporation Washington Mutual Inc. Waste Management, Inc. $38.46 29.05 17.93 42.50 54.04 48.03 16.00 33.90 36.81 29.70 $31.35 36.92 13.43 22.72 30.10 50.00 8.50 7.05 37.65 27.12 2002 6/26/02 6/24/03 American International Group Apollo Group Inc. Bed Bath & Beyond Inc. Capital One Financial Corporation Health South Corporation KLA-Tencor Corporation McKesson Corporation Pfizer Inc. Wendy's International Inc. Weyerhaeuser Company $66.24 38.62 36.92 56.80 12.35 43.61 33.30 35.00 $56.89 63.19 39.50 49.50 0.42 45.91 35.35 35.40 29.68 53.11 998 Source: "10 Uncommon Values in Common Stocks," Lehman Brothers, June 2003. Investment Committee Characteristics and Stock-Selection Exhibit 7 10 Uncommon Values Performance, 1977-2002 Financial Incentive Average Minutes per Analyst Firm Commitment Abnormal Return Cover-the-market return) Year Committee Size No No No High High High High High High Low Low No No Yes 1977 1978 1979 1980 1981 1982 1983 1984 1985 1986 1987 1988 1989 1990 1991 1992 1993 1994 1995 1996 1997 1998 1999 2000 2001 2002 Yes Yes MMMMOOOOOOOOOOO 10.97% 0.45% 12.93% -25.34% 15.84% 45.92% -0.17% 9.81% 3.26% -15.03% -2.38% 8.54% -4.60% 1.42% -8.17% 17.21% 16.05% -9.31% 4.96% 15.96% 20.14% 38.73% 5.58% -1.09% -4.54% -17.53% Yes Yes Low Low High High High High High High High Low Low High High High High High High Yes High Source Company records and can writer calculations Exhibit 8 Number of Lehman Brothers U.S. Equity Analysts and U.S. Companies Covered, 1984-2002 T 1200 A Analysts Companies D Number of U.S. Equity Analysts Number of U.S. Companies Covered Source Thomson Research, a Thomson Financial productStep by Step Solution
There are 3 Steps involved in it
Step: 1

Get Instant Access to Expert-Tailored Solutions
See step-by-step solutions with expert insights and AI powered tools for academic success
Step: 2

Step: 3
Ace Your Homework with AI
Get the answers you need in no time with our AI-driven, step-by-step assistance
Get Started
Banking And Beyond The Evolution Of Financing Along Traditional And Alternative Avenues
Authors: Caterina Cruciani, Gloria Gardenal , Elisa Cavezzali
1st Edition
3030457516,3030457524