

Answered step by step
Verified Expert Solution
Question
1 Approved Answer
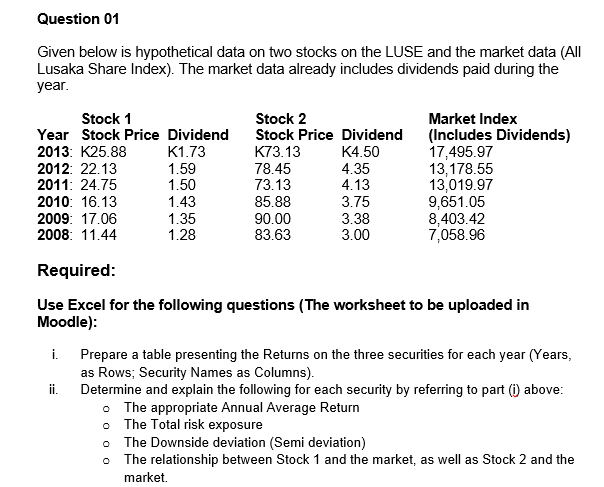
Question 01 Given below is hypothetical data on two stocks on the LUSE and the market data (All Lusaka Share Index). The market data already
Step by Step Solution
There are 3 Steps involved in it
Step: 1

Get Instant Access to Expert-Tailored Solutions
See step-by-step solutions with expert insights and AI powered tools for academic success
Step: 2

Step: 3
Ace Your Homework with AI
Get the answers you need in no time with our AI-driven, step-by-step assistance
Get Started
Supply Chain Finance Solutions
Authors: Erik Hofmann, Oliver Belin
1st Edition
3642175651, 978-3642175657