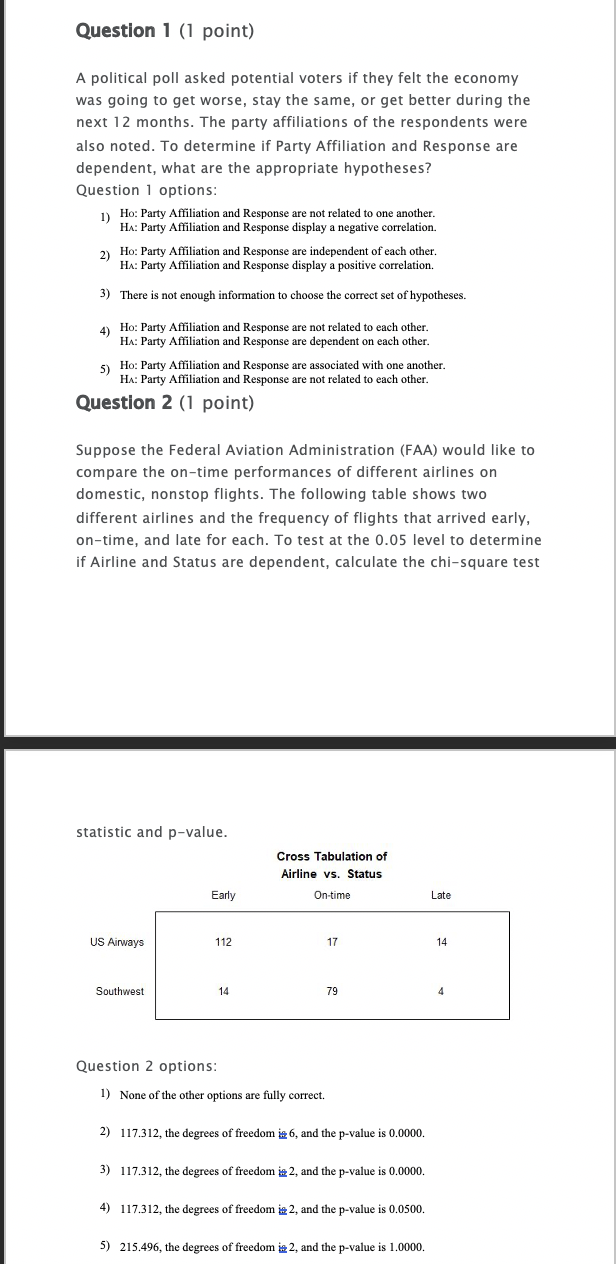
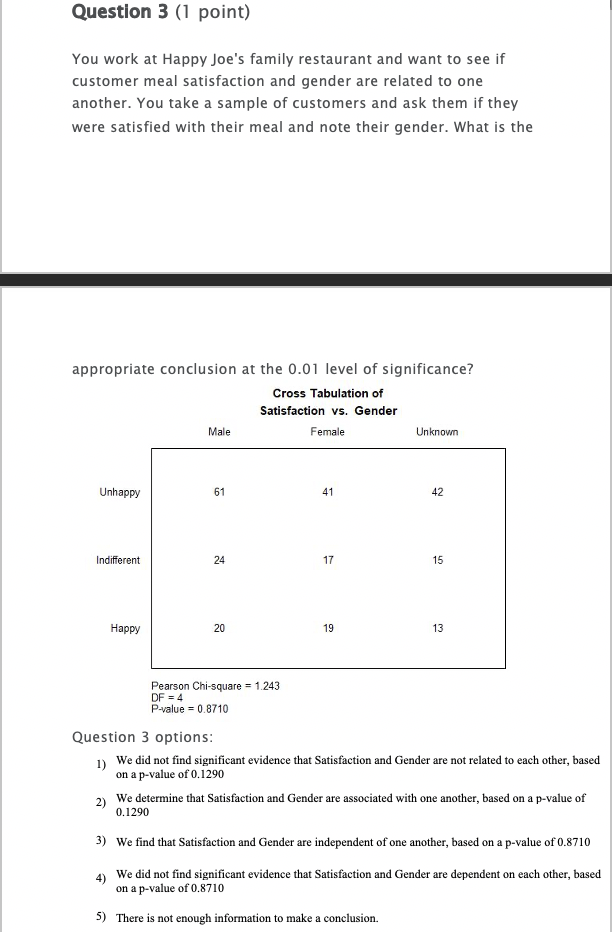
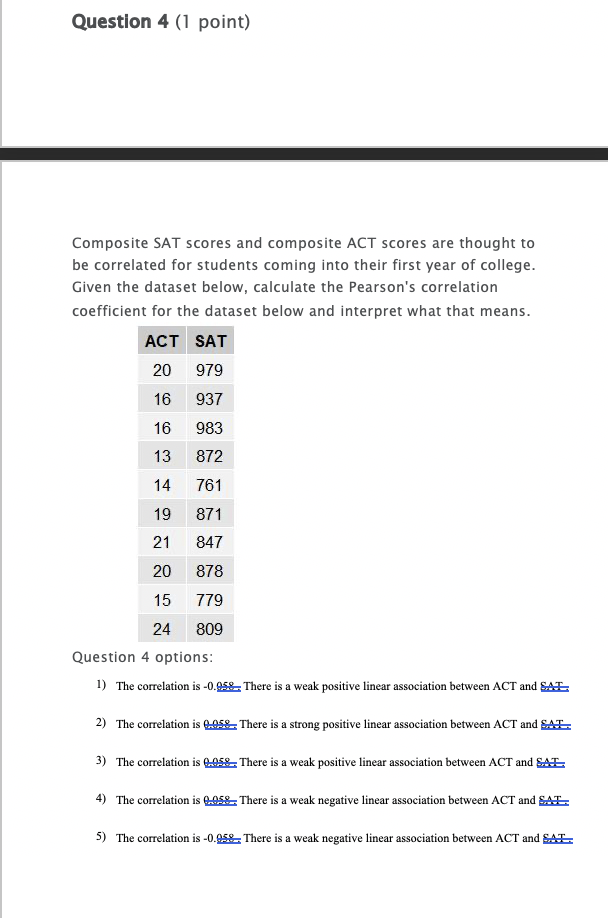
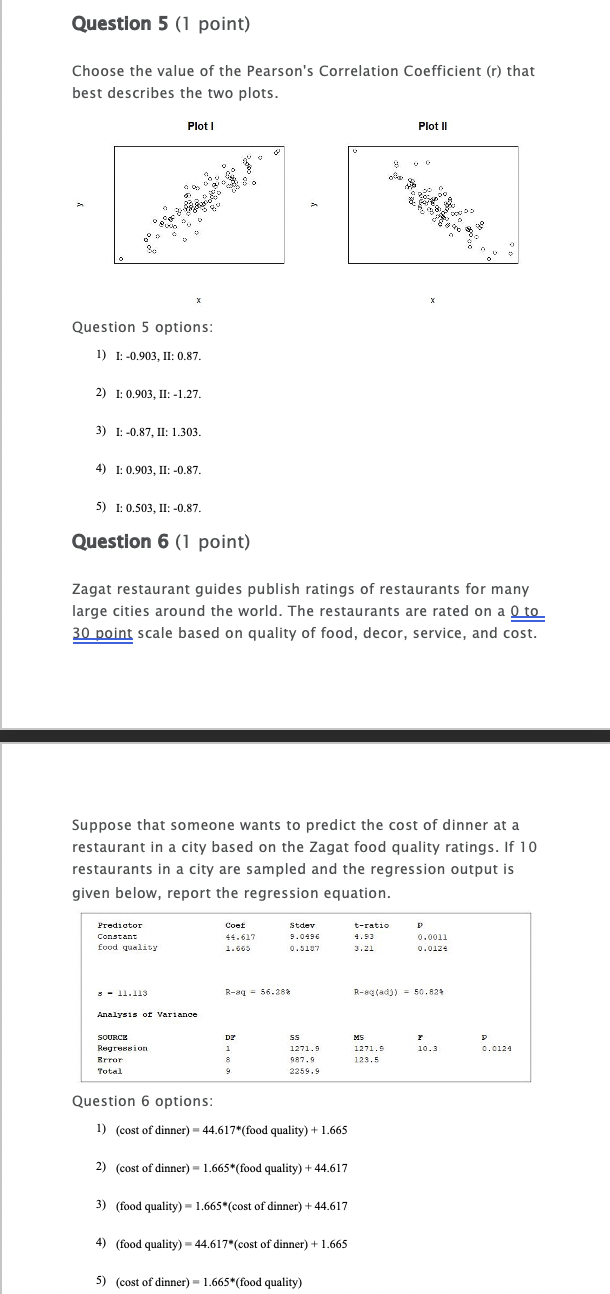
Question 1 (1 point) A political poll asked potential voters if they felt the economy was going to get worse, stay the same, or get better during the next 12 months. The party affiliations of the respondents were also noted. To determine if Party Affiliation and Response are dependent, what are the appropriate hypotheses? Question 1 options: Ho: Party Affiliation and Response are not related to one another. HA: Party Affiliation and Response display a negative correlation. 2) Ho: Party Affiliation and Response are independent of each other. HA: Party Affiliation and Response display a positive correlation. 3) There is not enough information to choose the correct set of hypotheses. 4) Ho: Party Affiliation and Response are not related to each other. HA: Party Affiliation and Response are dependent on each other. 5) Ho: Party Affiliation and Response are associated with one another. HA: Party Affiliation and Response are not related to each other. Question 2 (1 point) Suppose the Federal Aviation Administration (FAA) would like to compare the on-time performances of different airlines on domestic, nonstop flights. The following table shows two different airlines and the frequency of flights that arrived early, on-time, and late for each. To test at the 0.05 level to determine if Airline and Status are dependent, calculate the chi-square test statistic and p-value. Cross Tabulation of Airline vs. Status Early On-time Late US Airways 112 17 14 Southwest 14 79 Question 2 options: 1) None of the other options are fully correct. 2) 117.312, the degrees of freedom in 6, and the p-value is 0.0000. 3) 117.312, the degrees of freedom in 2, and the p-value is 0.0000. 4) 117.312, the degrees of freedom in 2, and the p-value is 0.0500. 5) 215.496, the degrees of freedom in 2, and the p-value is 1.0000.Question 3 (1 point) You work at Happy Joe's family restaurant and want to see if customer meal satisfaction and gender are related to one another. You take a sample of customers and ask them if they were satisfied with their meal and note their gender. What is the appropriate conclusion at the 0.01 level of significance? Cross Tabulation of Satisfaction vs. Gender Male Female Unknown Unhappy 61 41 42 Indifferent 24 17 15 Happy 20 19 13 Pearson Chi-square = 1.243 DF = 4 P-value = 0.8710 Question 3 options: 1) We did not find significant evidence that Satisfaction and Gender are not related to each other, based on a p-value of 0.1290 2) We determine that Satisfaction and Gender are associated with one another, based on a p-value of 0.1290 3) We find that Satisfaction and Gender are independent of one another, based on a p-value of 0.8710 4) We did not find significant evidence that Satisfaction and Gender are dependent on each other, based on a p-value of 0.8710 5) There is not enough information to make a conclusion.Question 4 (1 point) Composite SAT scores and composite ACT scores are thought to be correlated for students coming into their first year of college. Given the dataset below, calculate the Pearson's correlation coefficient for the dataset below and interpret what that means. ACT SAT 20 979 16 937 16 983 13 872 14 761 19 871 21 847 20 878 15 779 24 809 Question 4 options: 1) The correlation is -0.958- There is a weak positive linear association between ACT and SAT 2) The correlation is 9058_ There is a strong positive linear association between ACT and SAT 3) The correlation is 6058 There is a weak positive linear association between ACT and SAT 4) The correlation is 6058. There is a weak negative linear association between ACT and SAT- 5) The correlation is -0.958- There is a weak negative linear association between ACT and SAT-Question 5 (1 point) Choose the value of the Pearson's Correlation Coefficient (r) that best describes the two plots. Plot I Plot II Question 5 options: 1) 1: -0.903, II: 0.87. 2) 1: 0.903, II: -1.27. 3) 1: -0.87, II: 1.303. 4) 1: 0.903, II: -0.87. 5) 1: 0.503, II: -0.87. Question 6 (1 point) Zagat restaurant guides publish ratings of restaurants for many large cities around the world. The restaurants are rated on a 0 to 30 point scale based on quality of food, decor, service, and cost. Suppose that someone wants to predict the cost of dinner at a restaurant in a city based on the Zagat food quality ratings. If 10 restaurants in a city are sampled and the regression output is given below, report the regression equation. Predictor Coof Stdev t-ratio Constant 44. 617 9. 0496 4. 9 0.0011 food quality 1. 565 0. 5107 3.21 0.0124 g - 1.113 R-8q = 56.28% R-aq (adj) = 50. 824 Analysis of Variance SOURCE SS MS D 1301 8283687 1271.9 1271. 9 10.3 0. 0124 Error 987. 123. 5 Total 2259 .9 Question 6 options: 1) (cost of dinner) = 44.617*(food quality) + 1.665 2) (cost of dinner) = 1.665*(food quality) + 44.617 3) (food quality) = 1.665*(cost of dinner) + 44.617 4) (food quality) = 44.617*(cost of dinner) + 1.665 5) (cost of dinner) = 1.665*(food quality)