Answered step by step
Verified Expert Solution
Question
1 Approved Answer
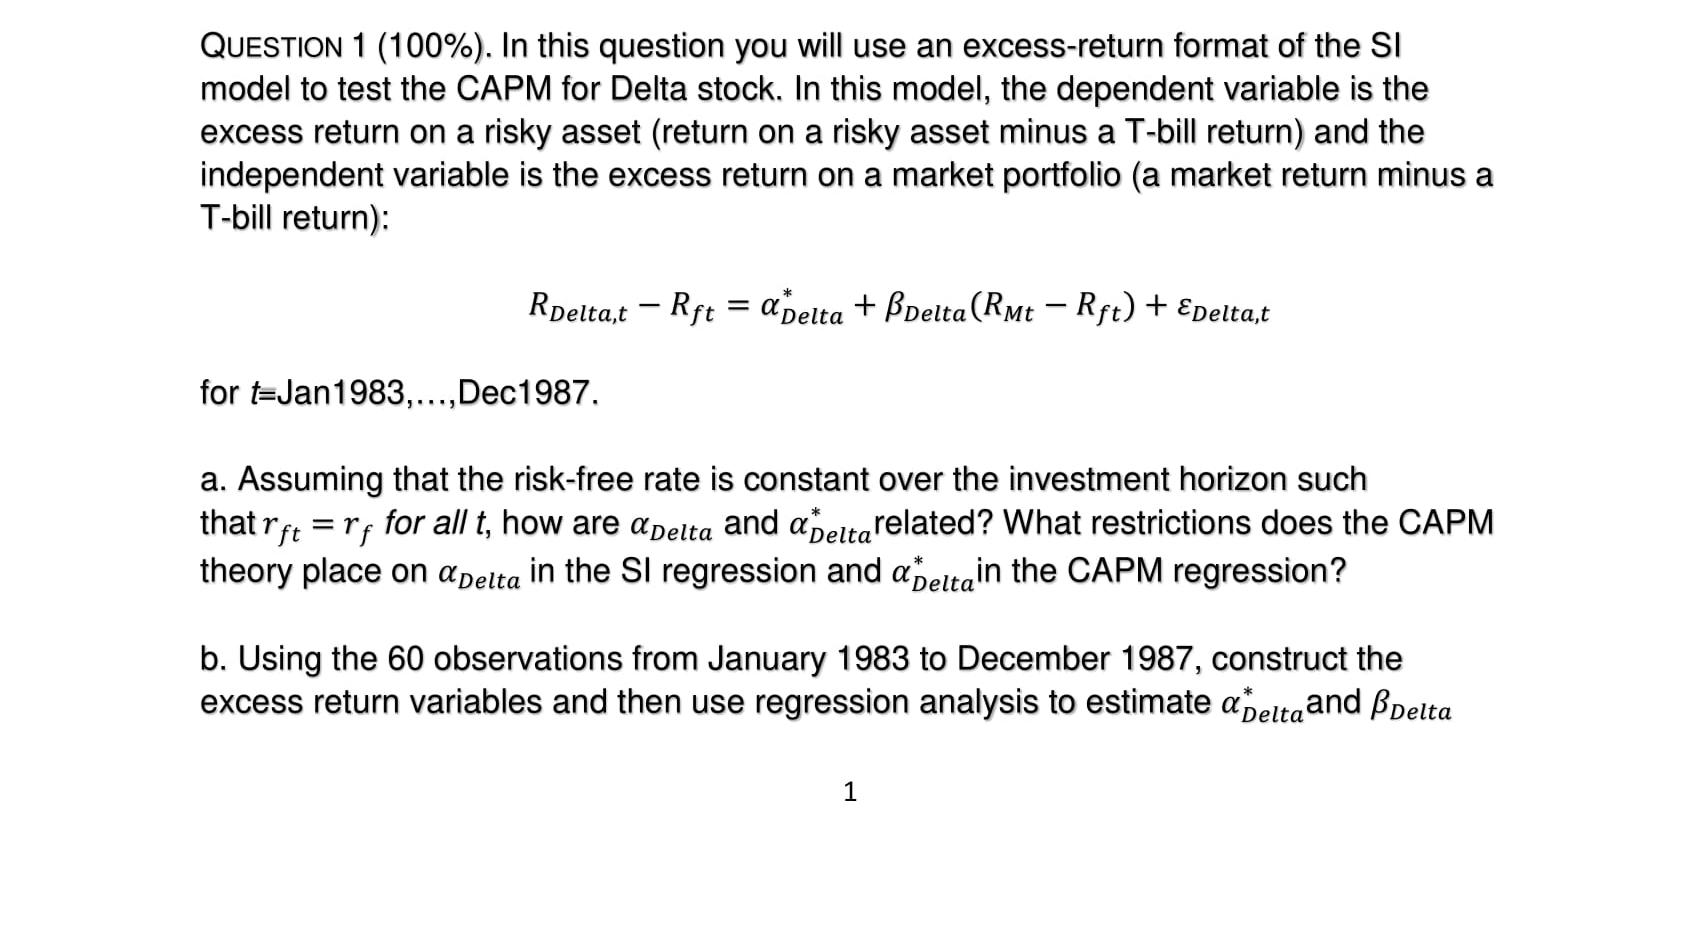
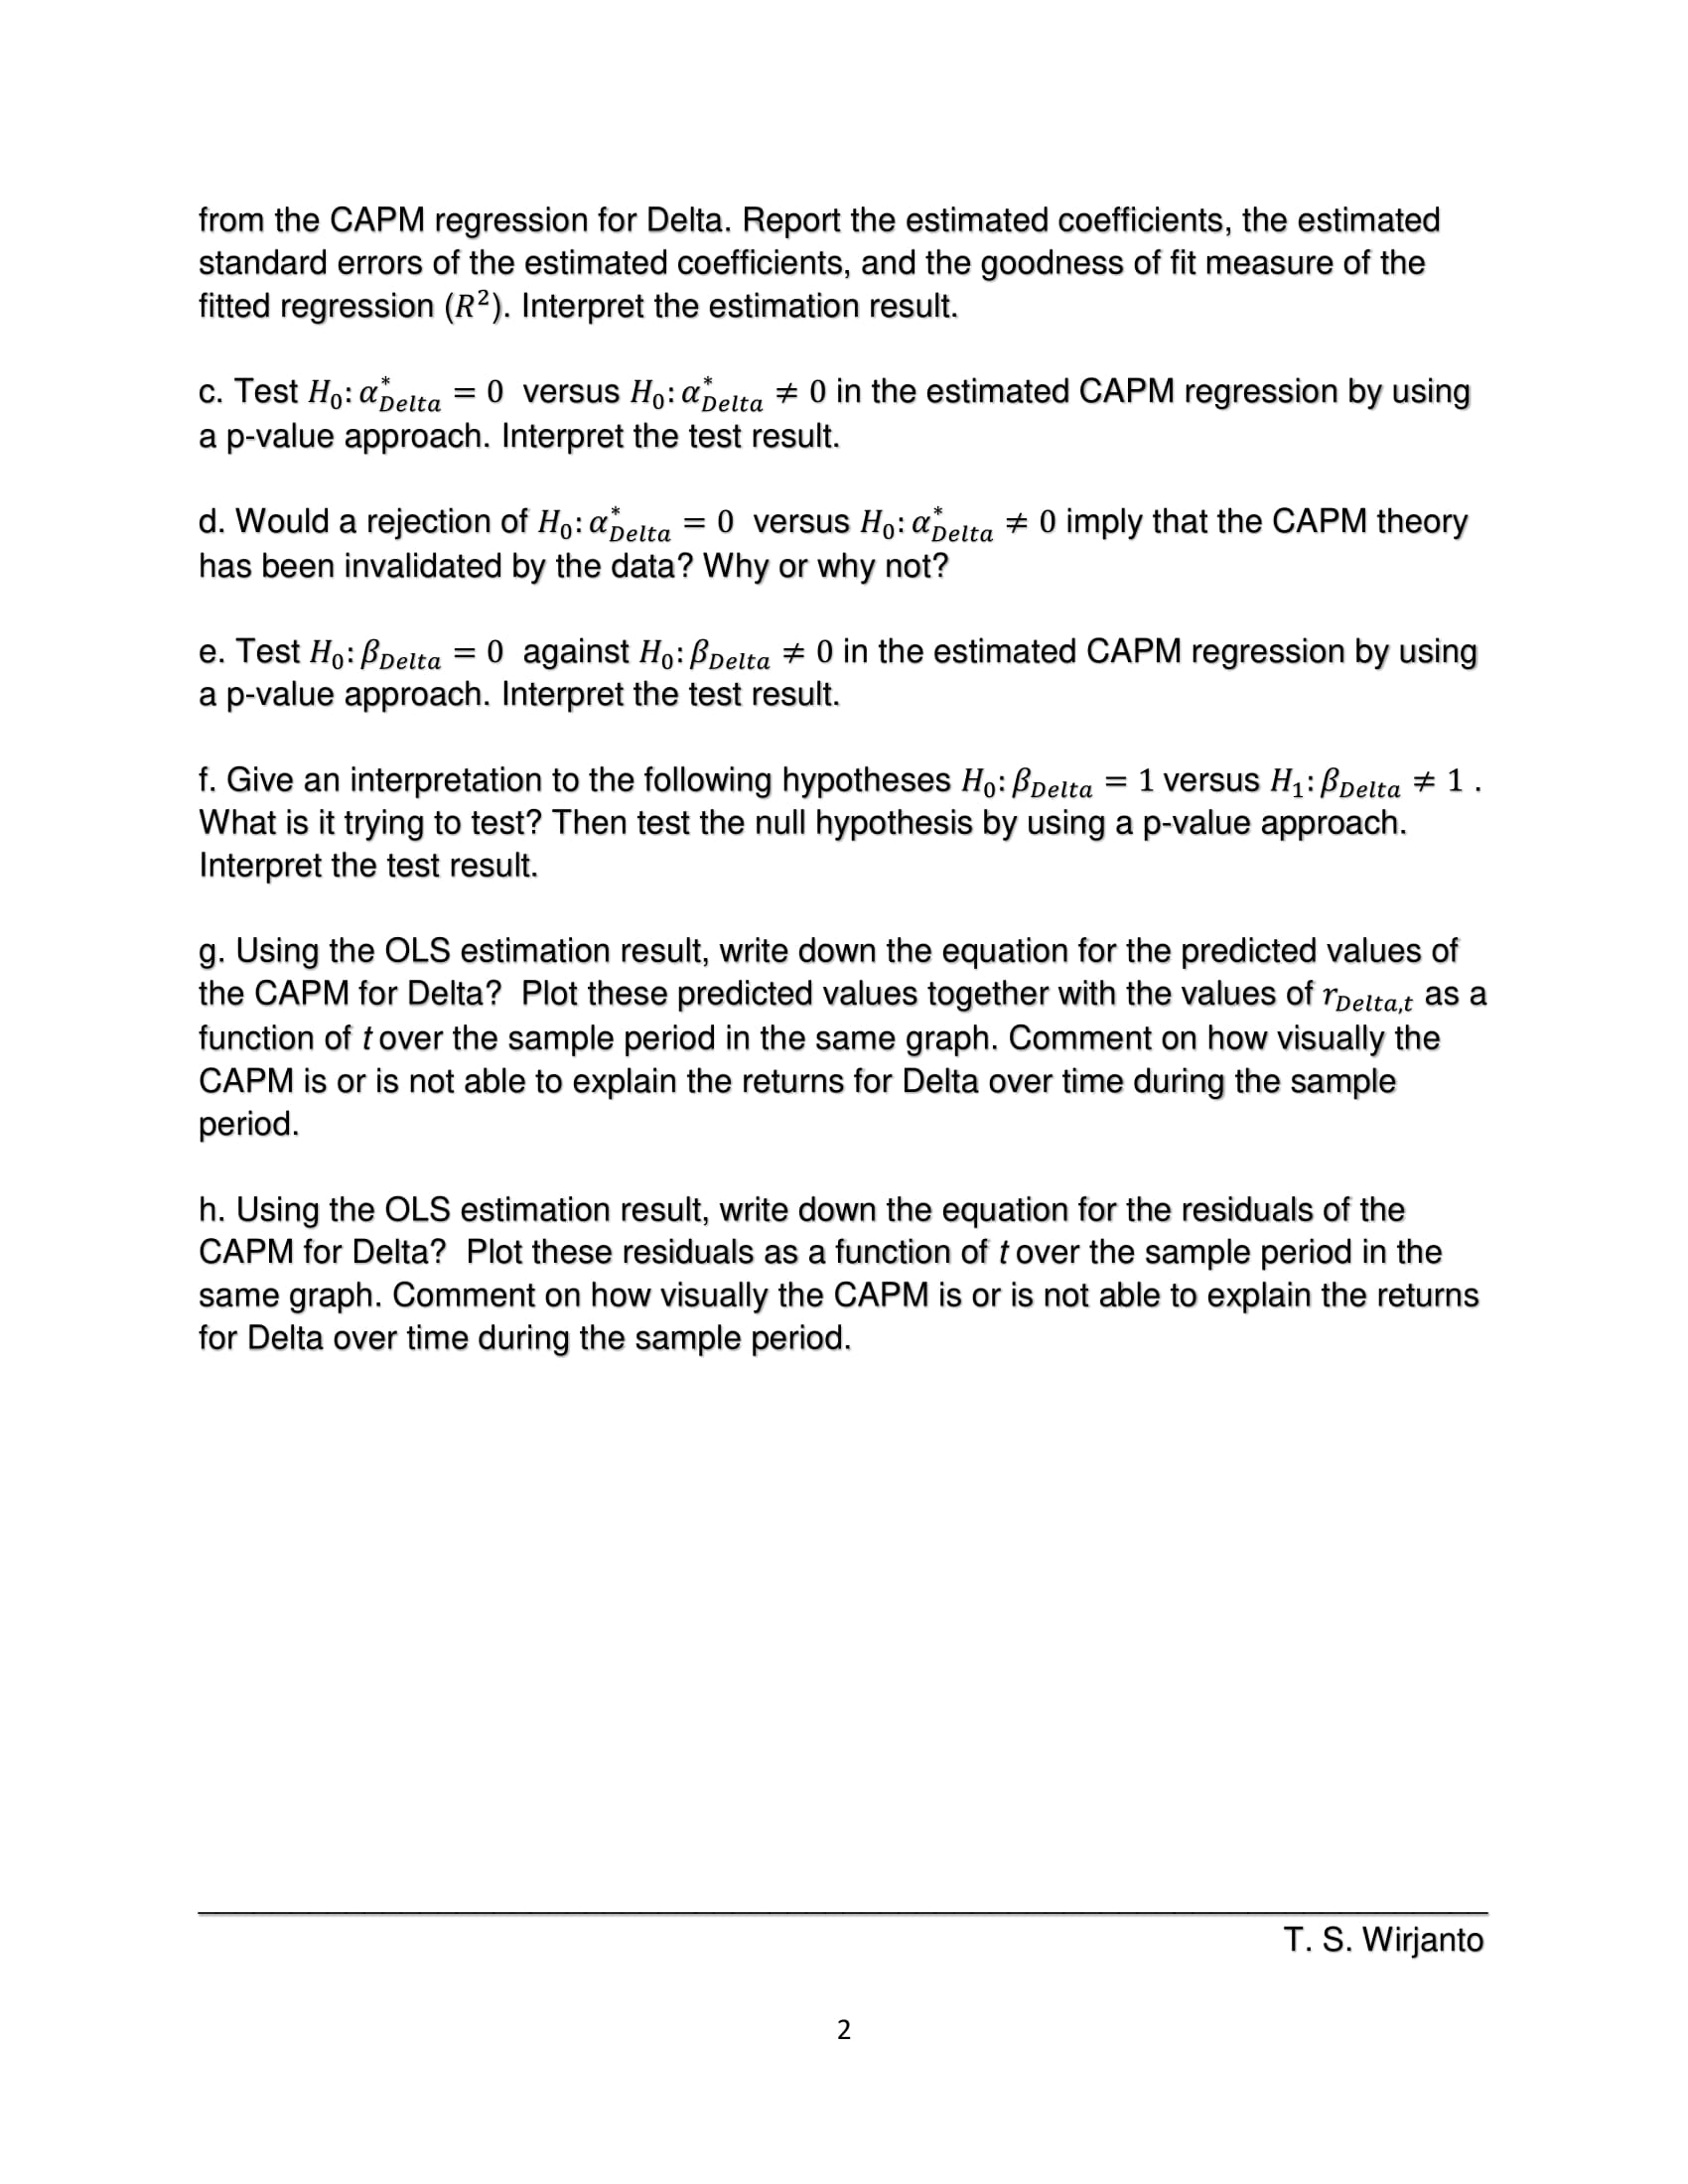
QUESTION 1 (100%). In this question you will use an excess-return format of the SI model to test the CAPM for Delta stock. In


QUESTION 1 (100%). In this question you will use an excess-return format of the SI model to test the CAPM for Delta stock. In this model, the dependent variable is the excess return on a risky asset (return on a risky asset minus a T-bill return) and the independent variable is the excess return on a market portfolio (a market return minus a T-bill return): Roelta,t Rft=aDelta + PDelta (RMt - Rft)+ EDelta,t for t=Jan1983,...,Dec1987. a. Assuming that the risk-free rate is constant over the investment horizon such that rft = rf for all t, how are a Delta and apelta related? What restrictions does the CAPM theory place on a Delta in the SI regression and a peltain the CAPM regression? b. Using the 60 observations from January 1983 to December 1987, construct the excess return variables and then use regression analysis to estimate a Delta and Delta 1 from the CAPM regression for Delta. Report the estimated coefficients, the estimated standard errors of the estimated coefficients, and the goodness of fit measure of the fitted regression (R2). Interpret the estimation result. c. Test Ho: a Delta 0 versus Ho: Delta 0 in the estimated CAPM regression by using a p-value approach. Interpret the test result. = d. Would a rejection of Ho: apelta 0 versus Ho: a Delta 0 imply that the CAPM theory has been invalidated by the data? Why or why not? e. Test Ho: PDelta = 0 against Ho: PDelta # 0 in the estimated CAPM regression by using a p-value approach. Interpret the test result. f. Give an interpretation to the following hypotheses Ho: Delta 1 versus H: Delta 1. What is it trying to test? Then test the null hypothesis by using a p-value approach. Inte ret the test result. g. Using the OLS estimation result, write down the equation for the predicted values of the CAPM for Delta? Plot these predicted values together with the values of spelta,t as a function of t over the sample period in the same graph. Comment on how visually the CAPM is or is not able to explain the returns for Delta over time during the sample period. h. Using the OLS estimation result, write down the equation for the residuals of the CAPM for Delta? Plot these residuals as a function of t over the sample period in the same graph. Comment on how visually the CAPM is or is not able to explain the returns for Delta over time during the sample period. 2 T. S. Wirjanto
Step by Step Solution
★★★★★
3.33 Rating (147 Votes )
There are 3 Steps involved in it
Step: 1
a In the excessreturn format of the Security Market Line SML model the intercept term Delta represents the assets abnormal return or excess return not ...
Get Instant Access to Expert-Tailored Solutions
See step-by-step solutions with expert insights and AI powered tools for academic success
Step: 2

Step: 3

Ace Your Homework with AI
Get the answers you need in no time with our AI-driven, step-by-step assistance
Get Started


