Question 1 [14 Points] Books at a library can be rated 1 star, 2 stars, 3 stars, or 4 stars, all with an equally likely
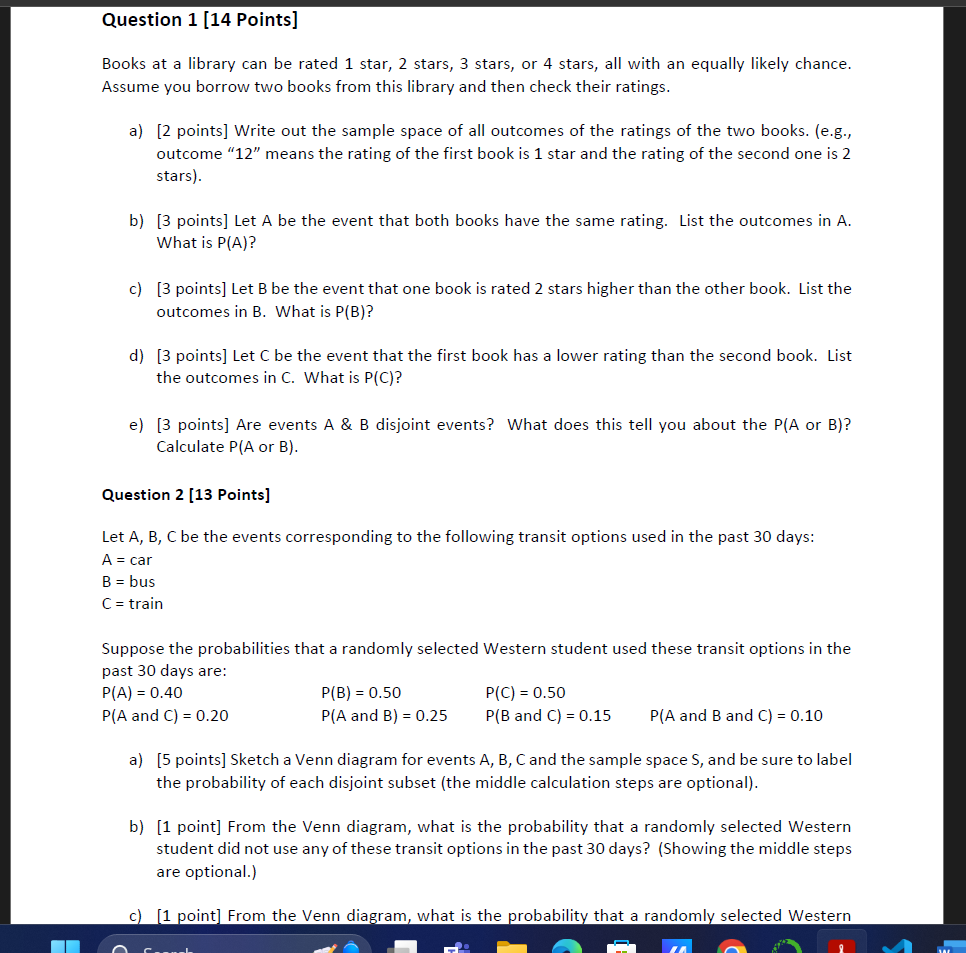
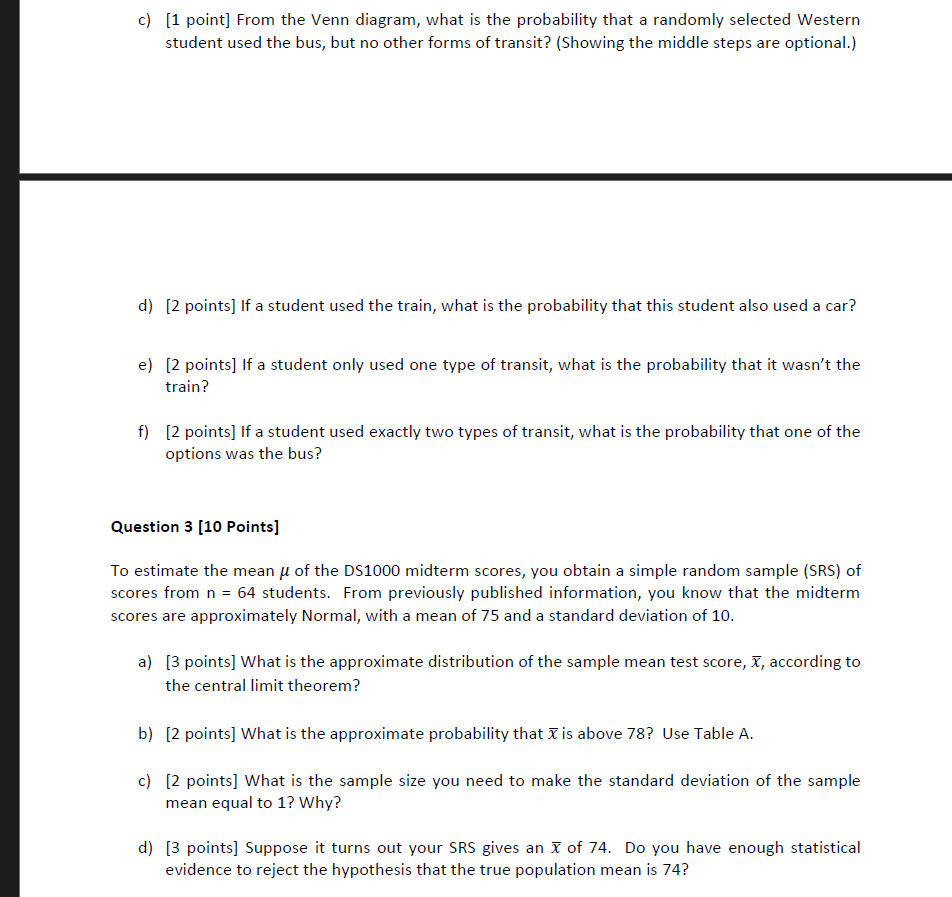
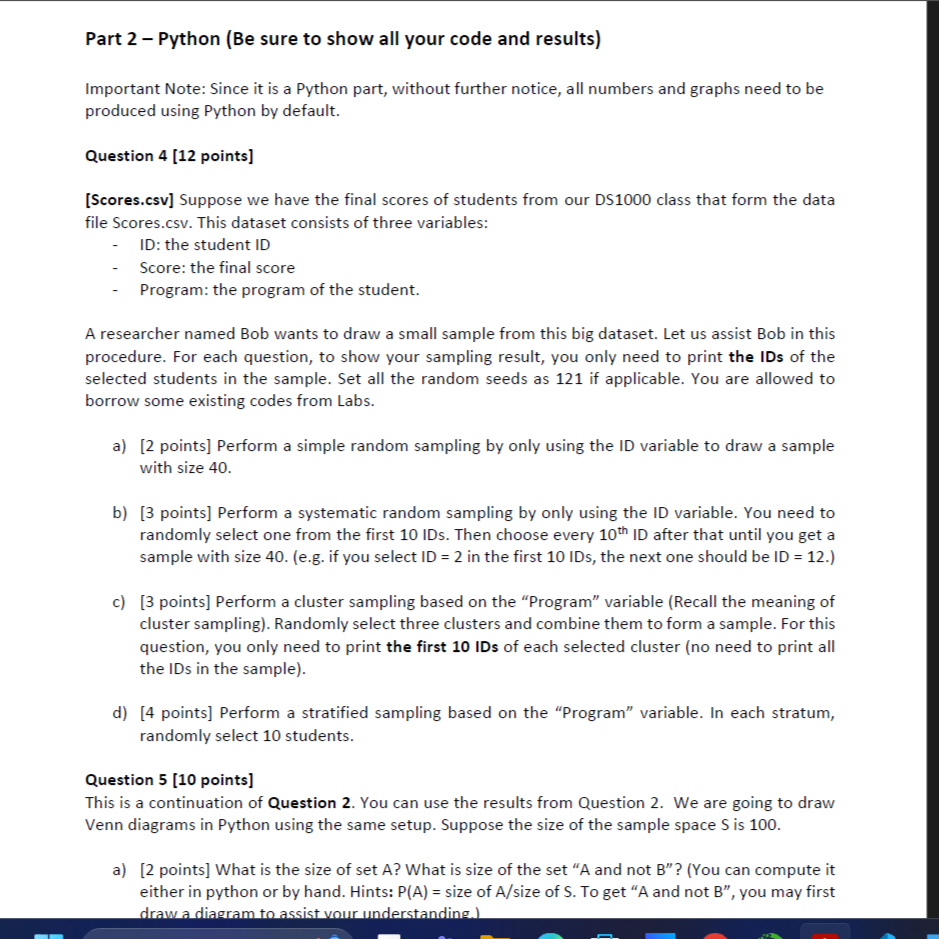
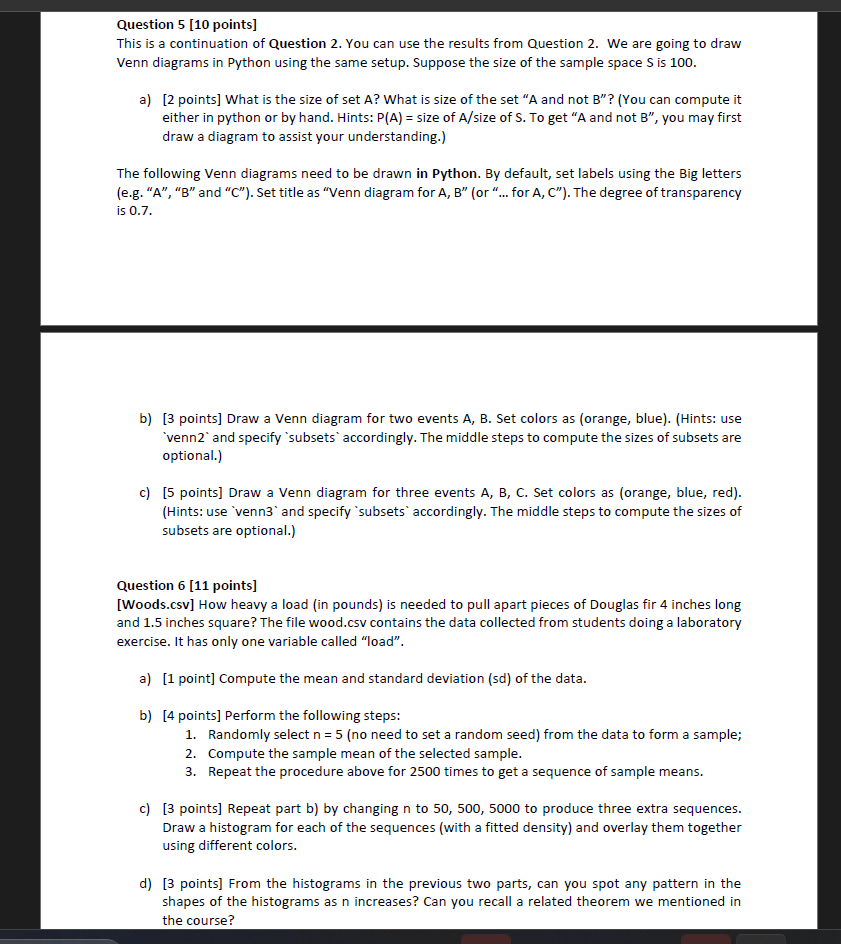
Question 1 [14 Points] Books at a library can be rated 1 star, 2 stars, 3 stars, or 4 stars, all with an equally likely chance. Assume you borrow two books from this library and then check their ratings. a) [2 points] Write out the sample space of all outcomes of the ratings of the two books. (e.g., outcome \"12\" means the rating of the first book is 1 star and the rating of the second one is 2 stars). [3 points] Let A be the event that both books have the same rating. List the outcomes in A, What is P(A)? 3 points] Let B be the eventthat one book is rated 2 stars higher than the other book. List the outcomes in B. What is P(B)? d) [3 points] Let C be the event that the first book has a lower rating than the second book. List the outcomes in C. What is P(C)? e} [3 points] Are events A & B disjoint events? What does this tell you about the P(A or B)? Calculate P(A or B). Question 2 [13 Points] Let A, B, C be the events corresponding to the following transit options used in the past 30 days: A =car B =bus C = train Suppose the probabilities that a randomly selected Western student used these transit options in the past 30 days are: P(A) = 0.40 P(B) = 0.50 P(C) = 0.50 P{A and C)=0.20 P(Aand B)=0.25 P(E and C) =0.15 P{A and B and C)=0.10 a) [5 points] Sketch a Venn diagram for events A, B, Cand the sample space , and be sure to label the probability of each disjoint subset (the middle calculation steps are optional). [1 point] From the Venn diagram, what is the probability that a randomly selected Western student did not use any of these transit options in the past 30 days? (Showing the middle steps are optional.) ram, what is the probahility that a randomly selected Western c) d) e) f) [1 point] From the Yenn diagram, what is the probabhility that a randomly selected Western student used the bus, but no other forms of transit? (Showing the middle steps are optional.) [2 points] If a student used the train, what is the probability that this student also used a car? [2 points] If a student only used one type of transit, what is the probability that it wasn't the train? [2 points] If a student used exactly two types of transit, what is the probabhility that one of the options was the bus? Question 3 [10 Points] To estimate the mean y of the DS1000 midterm scores, you obtain a simple random sample (SRS) of scores from n = 64 students. From previously published information, you know that the midterm scores are approximately Normal, with a mean of 75 and a standard deviation of 10. a) b) c) d) [3 points] What is the approximate distribution of the sample mean test score, X, according to the central limit theorem? [2 points] What is the approximate probability that X is above 787 Use Table A. [2 points] What is the sample size you need to make the standard deviation of the sample mean equal to 1? Why? [3 points] Suppose it turns out your SRS gives an X of 74. Do you have enough statistical evidence to reject the hypothesis that the true population mean is 747 Part 2 Python (Be sure to show all your code and results) Important Note: Since it is a Python part, without further notice, all numbers and graphs need to be produced using Python by default. Question 4 [12 points] [Scores.csv] Suppose we have the final scores of students from our DS1000 class that form the data file Scores.csv. This dataset consists of three variables: - ID: the student ID - Score: the final score - Program: the program of the student. A researcher named Bob wants to draw a small sample from this big dataset. Let us assist Bob in this procedure. For each question, to show your sampling result, you only need to print the IDs of the selected students in the sample. Set all the random seeds as 121 if applicable. You are allowed to borrow some existing codes from Labs. a) [2 points] Perform a simple random sampling by only using the ID variable to draw a sample with size 40. b) [3 points] Perform a systematic random sampling by only using the ID variable. You need to randomly select one from the first 10 IDs. Then choose every 10 ID after that until you get a sample with size 40. (e.g. if you select ID = 2 in the first 10 IDs, the next one should be ID = 12.) c) [3 points] Perform a cluster sampling based on the \"Program\" variable (Recall the meaning of cluster sampling). Randomly select three clusters and combine them to form a sample. For this question, you only need to print the first 10 IDs of each selected cluster (no need to print all the IDs in the sample). d) [4 points] Perform a stratified sampling based on the \"Program\" variable. In each stratum, randomly select 10 students. Question 5 [10 points] This is a continuation of Question 2. You can use the results from Question 2. We are going to draw Venn diagrams in Python using the same setup. Suppose the size of the sample space 5 is 100. a) [2 points] What is the size of set A? What is size of the set \"A and not B\"? (You can compute it either in python or by hand. Hints: P(A) = size of Afsize of 5. To get \"A and not B\Question 5 [10 points] This is a continuation of Question 2. You can use the results from Question 2. We are going to draw Venn diagrams in Python using the same setup. Suppose the size of the sample space S is 100. a) [2 points] What is the size of set AT What is size of the set \"A and not B"? (You can compute it either in python or by hand. Hints: P{A) = size of A/size of 5. To get \"A and not B\'wvenn2' and specify "subsets' accordingly. The middle steps to compute the sizes of subsets are optional.) c) [5 points] Draw a Venn diagram for three events A, B, C. Set colors as (orange, blue, red). (Hints: use "venn3' and specify "subsets' accordingly. The middle steps to compute the sizes of subsets are optional.) Question 6 [11 points] [Woods.csv] How heavy a load (in pounds) is needed to pull apart pieces of Douglas fir 4 inches long and 1.5 inches square? The file wood.csv contains the data collected from students doing a laboratory exercise, It has only one variable called \"load\". a) [1 point] Compute the mean and standard deviation (sd) of the data. b) [4 points] Perform the following steps: 1. Randomly select n =5 (no need to set a random seed) from the data to form a sample; 2. Compute the sample mean of the selected sample. 3. Repeat the procedure above for 2500 times to get a sequence of sample means. c) [3 points] Repesat part b) by changing n to 50, 500, 5000 to produce three extra sequences. Draw a histogram for each of the sequences (with a fitted density) and overlay them together using different colors. d) [3 points] From the histograms in the previous two parts, can you spot any pattern in the shapes of the histograms as n increases? Can you recall a related theorem we mentioned in the course
Step by Step Solution
There are 3 Steps involved in it
Step: 1
Get Instant Access to Expert-Tailored Solutions
See step-by-step solutions with expert insights and AI powered tools for academic success
Step: 2
Step: 3
Ace Your Homework with AI
Get the answers you need in no time with our AI-driven, step-by-step assistance