

Answered step by step
Verified Expert Solution
Question
1 Approved Answer
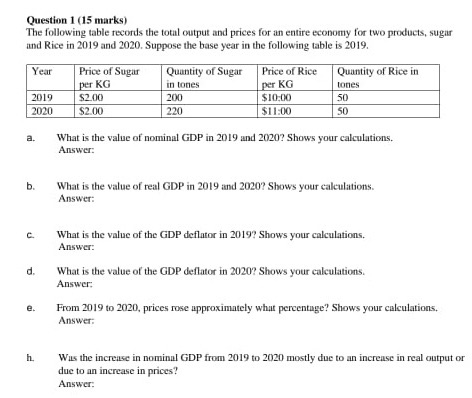
Question 1 (15 marks) The following table records the total output and prices for an entire economy for two products, sugar and Rice in 2019

Step by Step Solution
There are 3 Steps involved in it
Step: 1

Get Instant Access to Expert-Tailored Solutions
See step-by-step solutions with expert insights and AI powered tools for academic success
Step: 2

Step: 3
Ace Your Homework with AI
Get the answers you need in no time with our AI-driven, step-by-step assistance
Get Started
Economics
Authors: John Sloman, Jon Guest, Dean Garratt
10th edition
1292187859, 9781292187907 , 978-1292187853