

Answered step by step
Verified Expert Solution
Question
1 Approved Answer
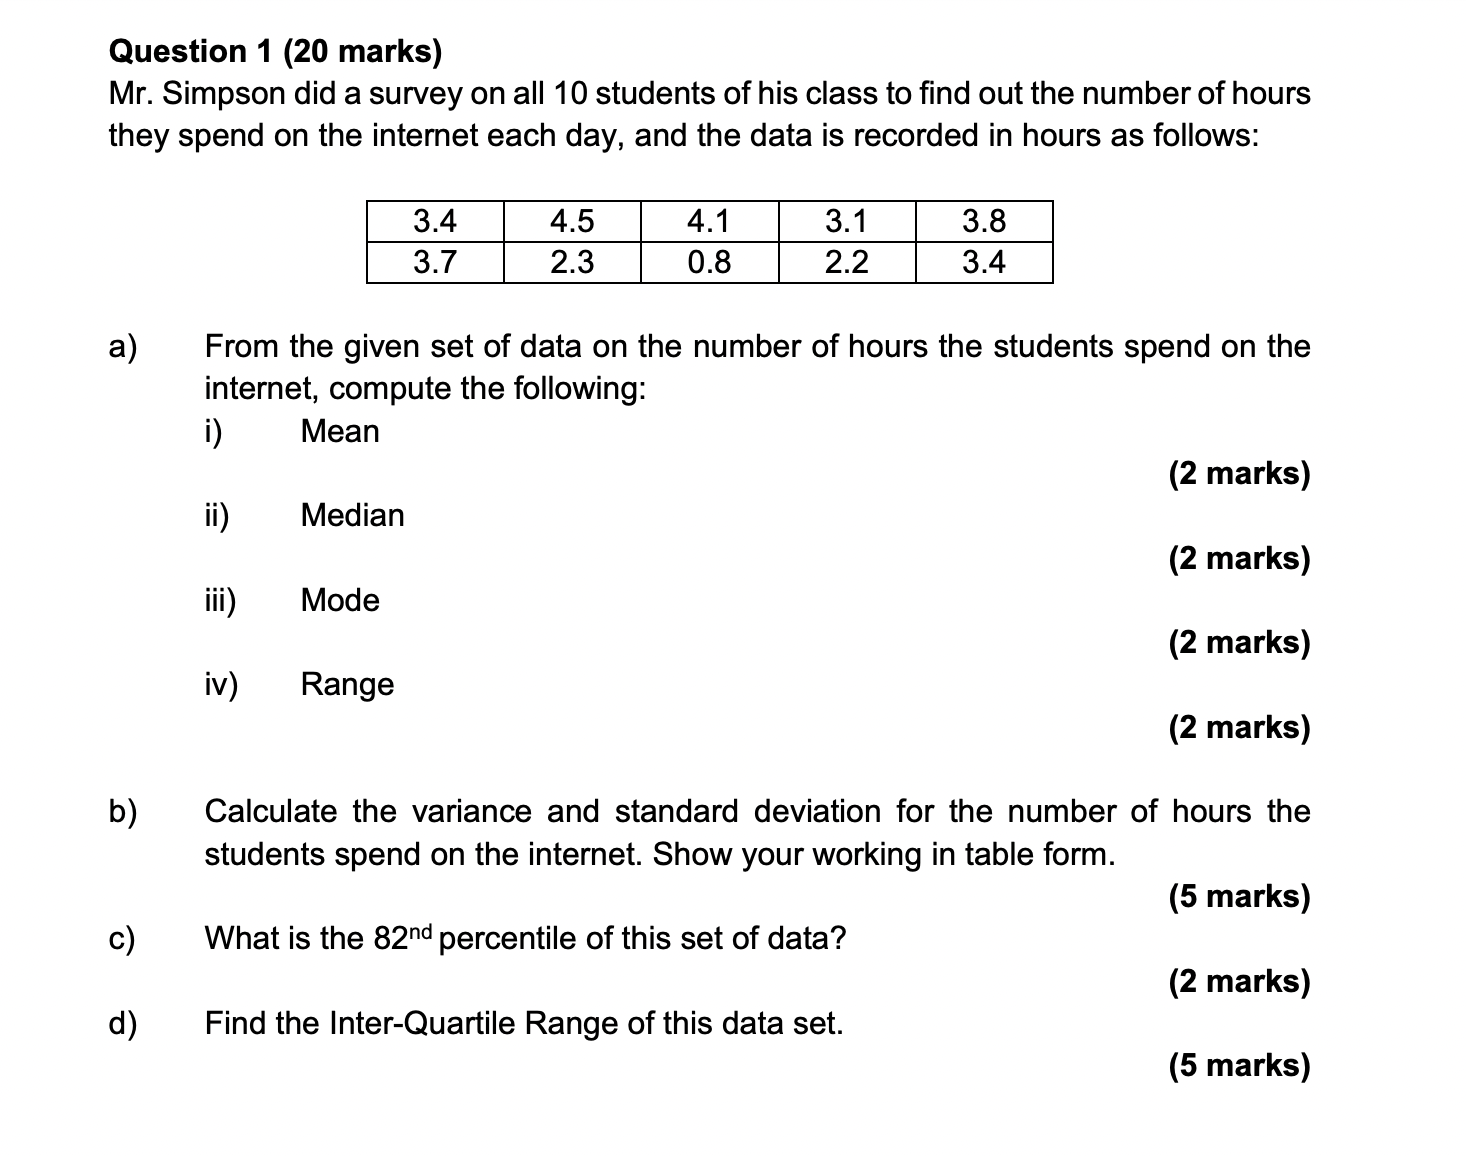
Question 1 (20 marks) Mr. Simpson did a survey on all 10 students of his class to nd out the number of hours they spend


Step by Step Solution
There are 3 Steps involved in it
Step: 1

Get Instant Access to Expert-Tailored Solutions
See step-by-step solutions with expert insights and AI powered tools for academic success
Step: 2

Step: 3
Ace Your Homework with AI
Get the answers you need in no time with our AI-driven, step-by-step assistance
Get Started
Elementary Number Theory
Authors: Underwood Dudley
1st Edition
0486134873, 9780486134871