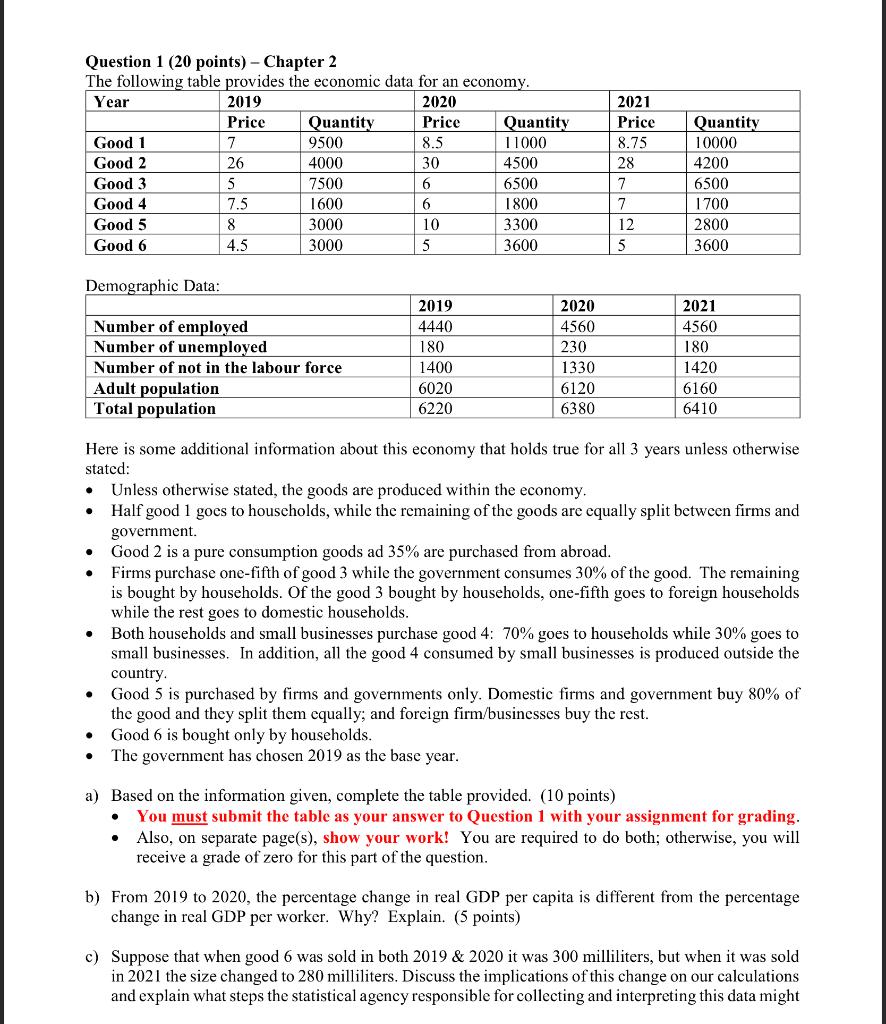
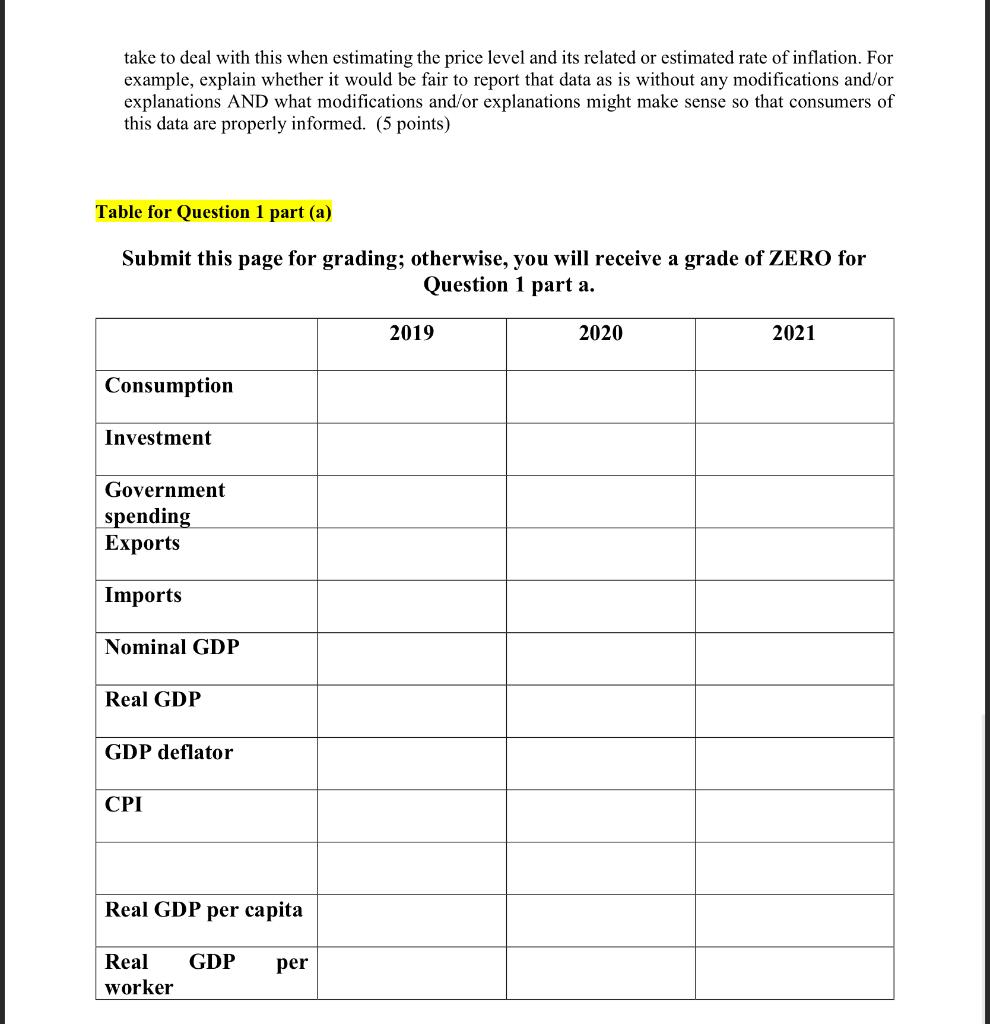
Question 1 (20 points) - Chapter 2 The follnwing tahle nrovides the eronomic. data for an economv Here is some additional information about this economy that holds true for all 3 years unless otherwise stated: - Unless otherwise stated, the goods are produced within the economy. - Half good 1 goes to houscholds, while the remaining of the goods are equally split between firms and government. - Good 2 is a pure consumption goods ad 35% are purchased from abroad. - Firms purchase one-fifth of good 3 while the government consumes 30% of the good. The remaining is bought by households. Of the good 3 bought by households, one-fifth goes to foreign households while the rest goes to domestic households. - Both households and small businesses purchase good 4: 70% goes to households while 30% goes to small businesses. In addition, all the good 4 consumed by small businesses is produced outside the country. - Good 5 is purchased by firms and governments only. Domestic firms and government buy 80% of the good and they split them equally; and foreign firm/businesses buy the rest. - Good 6 is bought only by households. - The government has chosen 2019 as the base year. a) Based on the information given, complete the table provided. (10 points) - You must submit the table as your answer to Question 1 with your assignment for grading. - Also, on separate page(s), show your work! You are required to do both; otherwise, you will receive a grade of zero for this part of the question. b) From 2019 to 2020 , the percentage change in real GDP per capita is different from the percentage change in real GDP per worker. Why? Explain. (5 points) c) Suppose that when good 6 was sold in both 2019 \& 2020 it was 300 milliliters, but when it was sold in 2021 the size changed to 280 milliliters. Discuss the implications of this change on our calculations and explain what steps the statistical agency responsible for collecting and interpreting this data might take to deal with this when estimating the price level and its related or estimated rate of inflation. For example, explain whether it would be fair to report that data as is without any modifications and/or explanations AND what modifications and/or explanations might make sense so that consumers of this data are properly informed. (5 points) Table for Question 1 part (a) Submit this page for grading; otherwise, you will receive a grade of ZERO for Question 1 part a. Question 1 (20 points) - Chapter 2 The follnwing tahle nrovides the eronomic. data for an economv Here is some additional information about this economy that holds true for all 3 years unless otherwise stated: - Unless otherwise stated, the goods are produced within the economy. - Half good 1 goes to houscholds, while the remaining of the goods are equally split between firms and government. - Good 2 is a pure consumption goods ad 35% are purchased from abroad. - Firms purchase one-fifth of good 3 while the government consumes 30% of the good. The remaining is bought by households. Of the good 3 bought by households, one-fifth goes to foreign households while the rest goes to domestic households. - Both households and small businesses purchase good 4: 70% goes to households while 30% goes to small businesses. In addition, all the good 4 consumed by small businesses is produced outside the country. - Good 5 is purchased by firms and governments only. Domestic firms and government buy 80% of the good and they split them equally; and foreign firm/businesses buy the rest. - Good 6 is bought only by households. - The government has chosen 2019 as the base year. a) Based on the information given, complete the table provided. (10 points) - You must submit the table as your answer to Question 1 with your assignment for grading. - Also, on separate page(s), show your work! You are required to do both; otherwise, you will receive a grade of zero for this part of the question. b) From 2019 to 2020 , the percentage change in real GDP per capita is different from the percentage change in real GDP per worker. Why? Explain. (5 points) c) Suppose that when good 6 was sold in both 2019 \& 2020 it was 300 milliliters, but when it was sold in 2021 the size changed to 280 milliliters. Discuss the implications of this change on our calculations and explain what steps the statistical agency responsible for collecting and interpreting this data might take to deal with this when estimating the price level and its related or estimated rate of inflation. For example, explain whether it would be fair to report that data as is without any modifications and/or explanations AND what modifications and/or explanations might make sense so that consumers of this data are properly informed. (5 points) Table for Question 1 part (a) Submit this page for grading; otherwise, you will receive a grade of ZERO for Question 1 part a