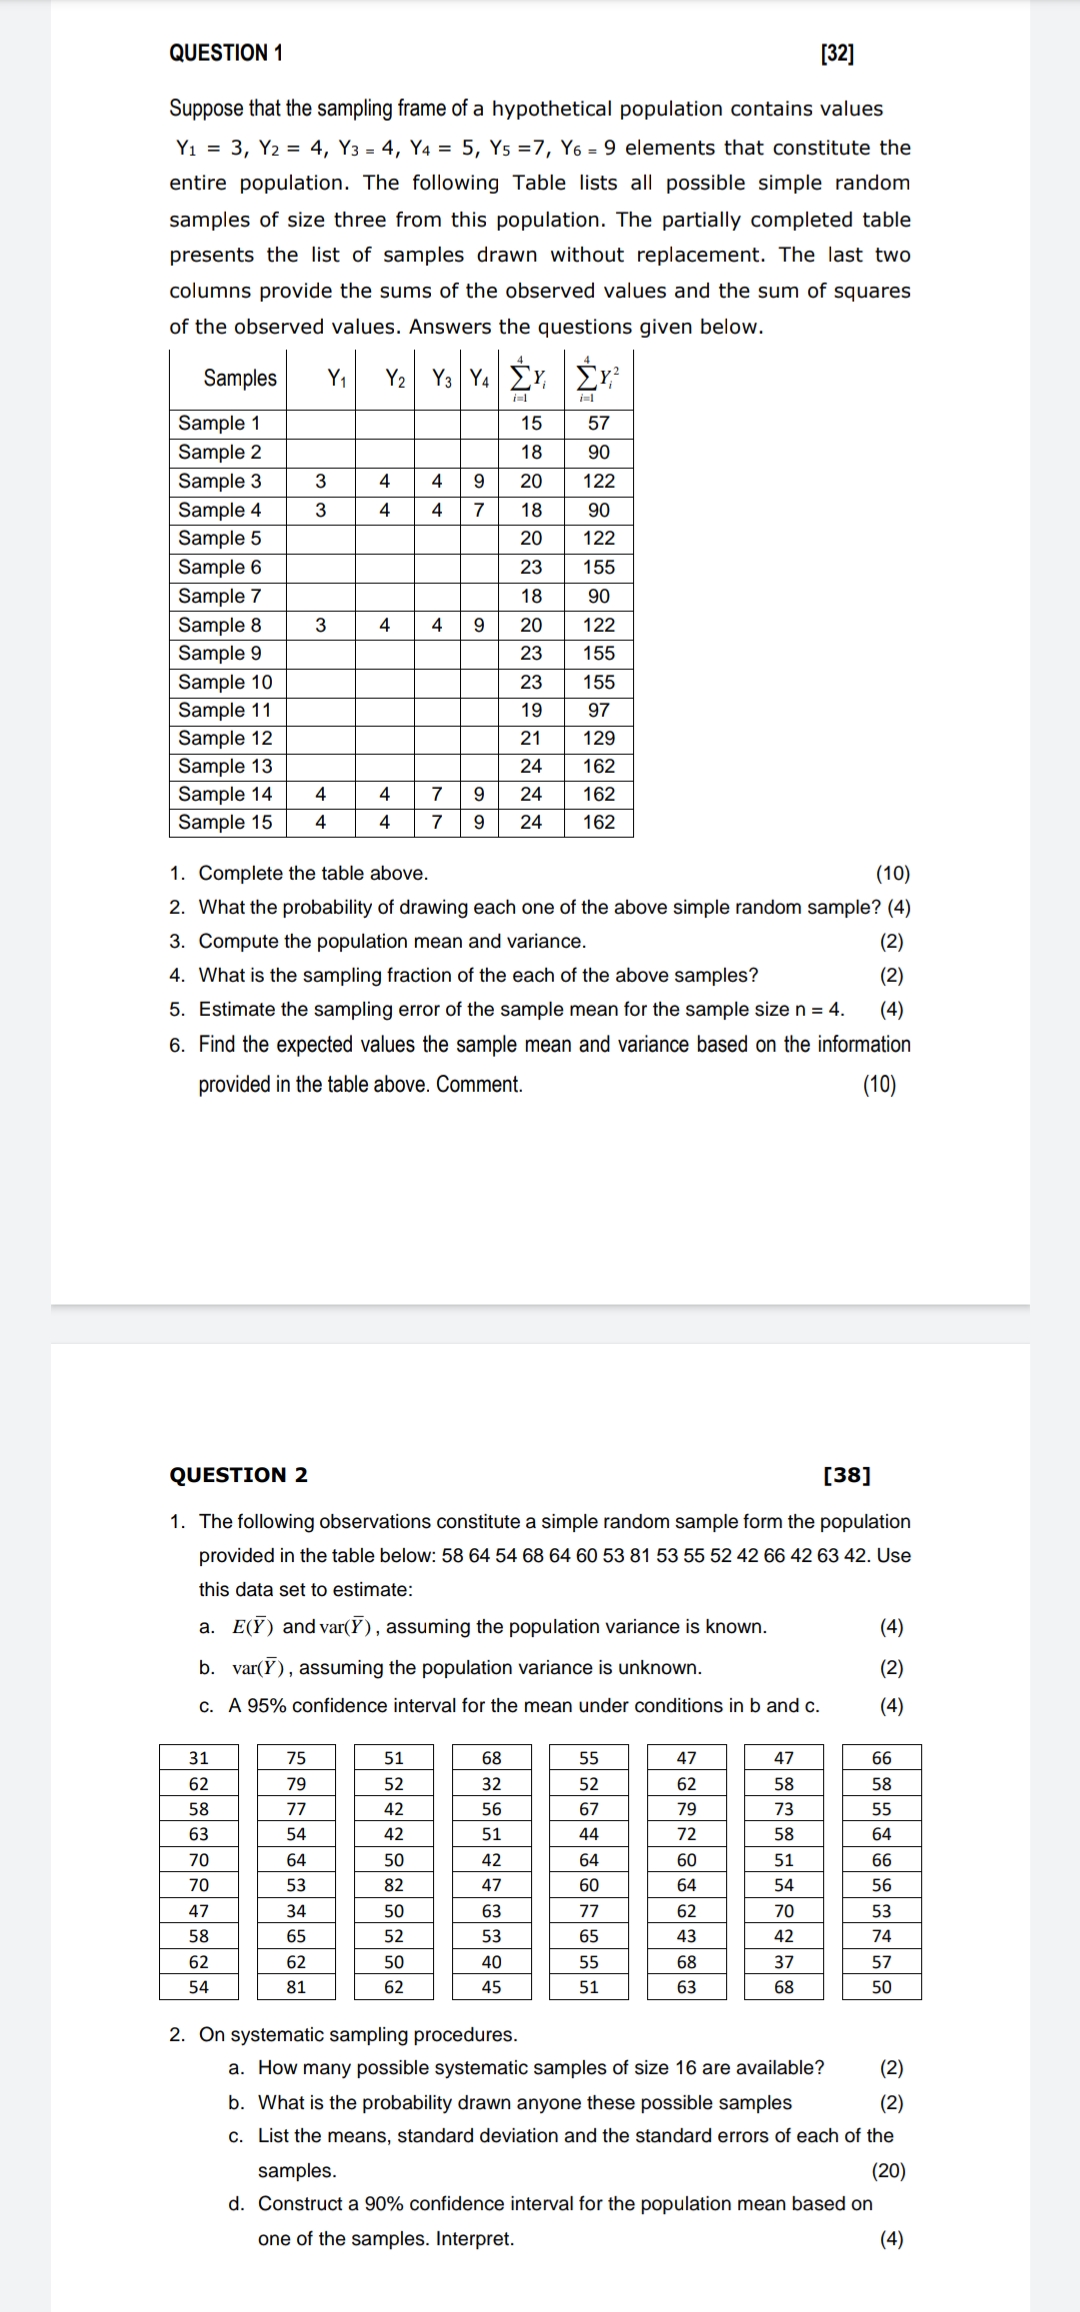
QUESTION 1 [32] Suppose that the sampling frame ofa hypothetical population contains values Y1 = 3, Y2 = 4, Y3 = 4, Y4 = 5, Y5 =7, Y5 = 9 elements that constitute the entire population. The following Table lists all possible simple random samples of size three from this population. The partially completed table presents the list of samples drawn without replacement. The last two columns provide the sums of the observed values and the sum of squares of the observed values. Answers the questions given below. 4 Samples Y1 Y2 Y3 Y4 Zi', it? tut i-l Sample 1 15 57 Sample 2 18 90 Sample 3 3 4 4 9 20 122 Sample 4 3 4 4 7 18 90 Sample 5 20 122 Sample 6 23 155 Sample 7 18 90 Sample 8 3 4 4 9 20 122 Sample 9 23 155 Sample 10 23 155 Sample 1 1 19 97 Sample 12 21 129 Sample 13 24 162 Sample 14 4 4 T 9 24 162 Sample 15 4 4 7 9 24 162 1. Complete the table above. (10) 2. What the probability of drawing each one of the above simple random sample? (4) 3. Compute the population mean and variance. (2) 4. What is the sampling fraction of the each of the above samples? (2) 5. Estimate the sampling error of the sample mean for the sample size n = 4. (4) 6. Find the expected values the sample mean and varianoe based on the information provided in the table above. Comment. (10) QUESTION 2 [38] 1. The following observations constitute a simple random sample form the population provided in the table below: 58 64 54 68 64 60 53 81 53 55 52 42 66 42 63 42. Use this data set to estimate: a. 07) and vat-(17), assuming the population variance is known. (4) b. vat-(l7). assuming the population variance is unknown. (2) c. A 95% contidenoe interval tor the mean under conditions in b and c. (4) 31 75 51 68 55 47 47 66 62 79 52 32 52 62 58 58 58 77 42 56 67 79 73 55 63 54 42 51 44 72 58 Ed 70 64 50 42 64 60 51 66 70 53 82 47 60 64 54 56 47 34 50 63 77 62 70 53 58 65 52 53 65 43 42 74 62 61 50 40 55 68 37 57 54 81 62 45 51 63 68 50 2. On systematic sampling procedures. a. How many possible systematic samples of size 16 are available? (2) b. What is the probability drawn anyone these possible samples (2) 5. List the means, standard deviation and the standard errors of each of the samples. (20) d. Construct a 90% contidenoe inteNal tor the population mean based on one of the samples. Interpret. (4)