Answered step by step
Verified Expert Solution
Question
1 Approved Answer
QUESTION 1 5 points The table below (Table 8.9, BMA) shows the correlation between returns of 7 different stocks. How likely is it that an
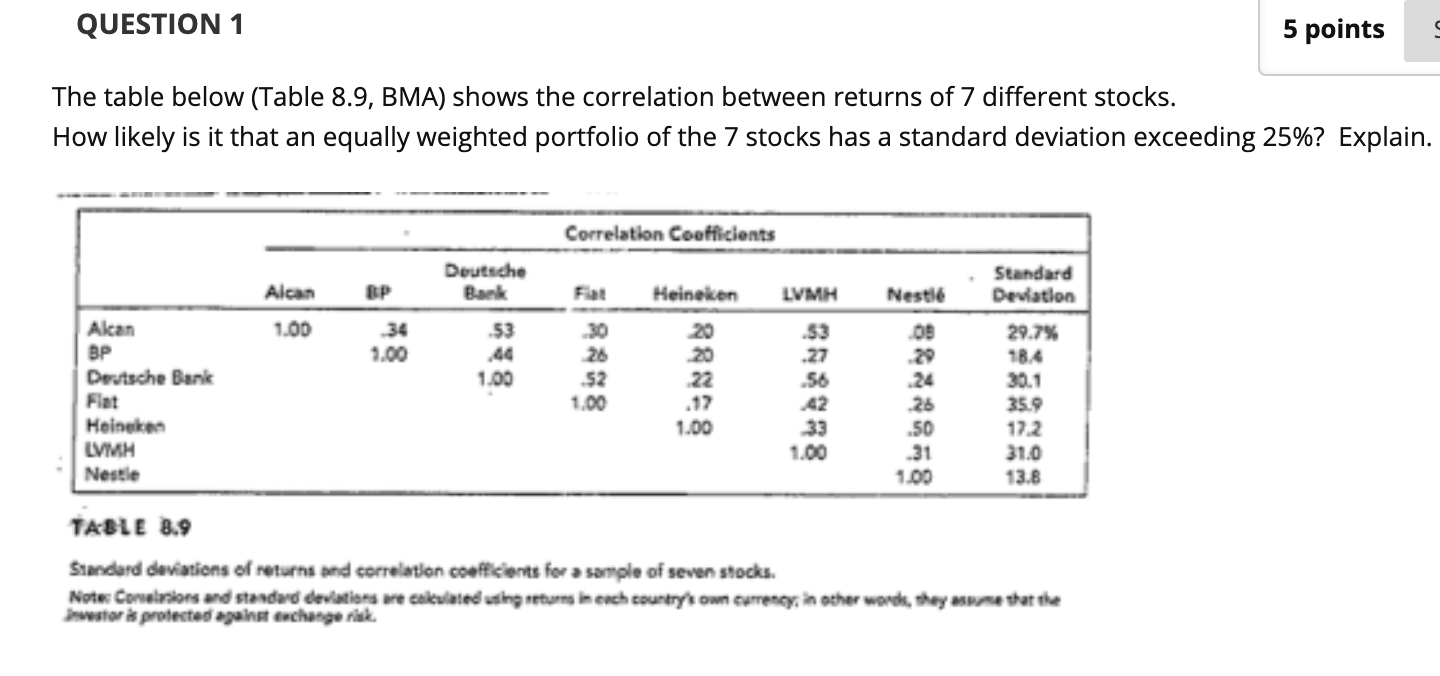
QUESTION 1 5 points The table below (Table 8.9, BMA) shows the correlation between returns of 7 different stocks. How likely is it that an equally weighted portfolio of the 7 stocks has a standard deviation exceeding 25%? Explain. Correlation Coefficients Deutsche Bank Alcan BP LVMH Nestle Standard Deviation 29.7% 18.4 1.00 Heineken 20 20 53 1.00 33 .27 .56 1.00 Alcan BP Deutsche Bank Flat Heineken LVIMH Nestle 52 1.00 26 .50 1.00 33 1.00 35.9 17.2 31.0 13.8 TABLE 8.9 Standard deviations of returns and correlation coefficients for sample of seven stocks. Note Contrors and standard deviations we cokelated using returns in each country own currency in other words, they were that the westor protected against exchange rik QUESTION 1 5 points The table below (Table 8.9, BMA) shows the correlation between returns of 7 different stocks. How likely is it that an equally weighted portfolio of the 7 stocks has a standard deviation exceeding 25%? Explain. Correlation Coefficients Deutsche Bank Alcan BP LVMH Nestle Standard Deviation 29.7% 18.4 1.00 Heineken 20 20 53 1.00 33 .27 .56 1.00 Alcan BP Deutsche Bank Flat Heineken LVIMH Nestle 52 1.00 26 .50 1.00 33 1.00 35.9 17.2 31.0 13.8 TABLE 8.9 Standard deviations of returns and correlation coefficients for sample of seven stocks. Note Contrors and standard deviations we cokelated using returns in each country own currency in other words, they were that the westor protected against exchange rik
Step by Step Solution
There are 3 Steps involved in it
Step: 1
Get Instant Access to Expert-Tailored Solutions
See step-by-step solutions with expert insights and AI powered tools for academic success
Step: 2
Step: 3
Ace Your Homework with AI
Get the answers you need in no time with our AI-driven, step-by-step assistance
Get Started