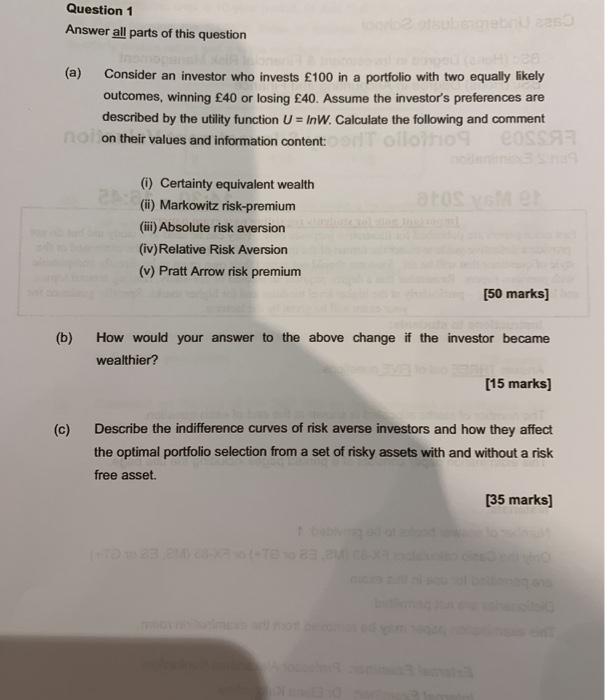
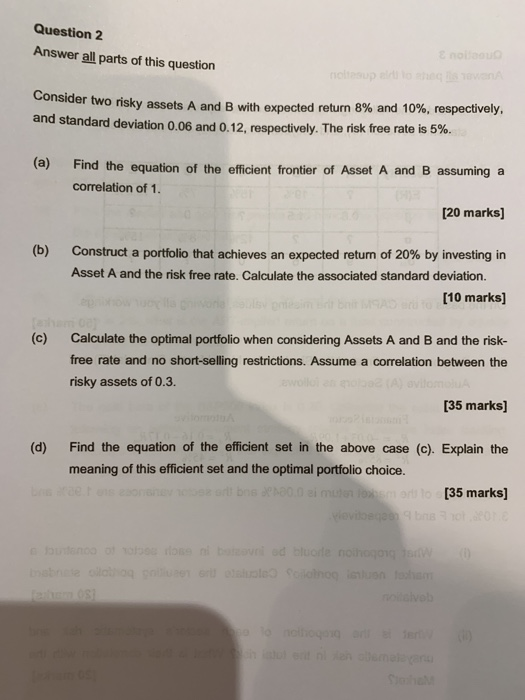
Question 1 Answer all parts of this question (a) Consider an investor who invests 100 in a portfolio with two equally likely outcomes, winning 40 or losing 40. Assume the investor's preferences are described by the utility function U- InW. Calculate the following and comment on their values and information content: () Certainty equivalent wealth (i) Markowitz risk-premium (ii) Absolute risk aversion (iv)Relative Risk Aversion (v) Pratt Arrow risk premium [50 marks (b) How would your answer to the above change if the investor became wealthier? [15 marks) Describe the indifference curves of risk averse investors and how they affect (c) the optimal portfolio selection from a set of risky assets with and without a risk free asset. [35 marks) Question 2 Answer all parts of this question Consider two risky assets A and B with expected return 8% and 10%, respectively. and standard deviation 0.06 and 0.12, respectively. The risk free rate is 5%. (a) Find the equation of the efficient frontier of Asset A and B assuming a correlation of 1. [20 marks] (b) Construct a portfolio that achieves an expected return of 20% by investing in Asset A and the risk free rate. Calculate the associated standard deviation. [10 marks Calculate the optimal portfolio when considering Assets A and B and the risk- (c) free rate and no short-selling restrictions. Assume a correlation between the risky assets of 0.3. [35 marks] Find the equation of the efficient set in the above case (c). Explain the (d) meaning of this efficient set and the optimal portfolio choice. 135 marks] Question 1 Answer all parts of this question (a) Consider an investor who invests 100 in a portfolio with two equally likely outcomes, winning 40 or losing 40. Assume the investor's preferences are described by the utility function U- InW. Calculate the following and comment on their values and information content: () Certainty equivalent wealth (i) Markowitz risk-premium (ii) Absolute risk aversion (iv)Relative Risk Aversion (v) Pratt Arrow risk premium [50 marks (b) How would your answer to the above change if the investor became wealthier? [15 marks) Describe the indifference curves of risk averse investors and how they affect (c) the optimal portfolio selection from a set of risky assets with and without a risk free asset. [35 marks) Question 2 Answer all parts of this question Consider two risky assets A and B with expected return 8% and 10%, respectively. and standard deviation 0.06 and 0.12, respectively. The risk free rate is 5%. (a) Find the equation of the efficient frontier of Asset A and B assuming a correlation of 1. [20 marks] (b) Construct a portfolio that achieves an expected return of 20% by investing in Asset A and the risk free rate. Calculate the associated standard deviation. [10 marks Calculate the optimal portfolio when considering Assets A and B and the risk- (c) free rate and no short-selling restrictions. Assume a correlation between the risky assets of 0.3. [35 marks] Find the equation of the efficient set in the above case (c). Explain the (d) meaning of this efficient set and the optimal portfolio choice. 135 marks]