Question 1: APS Model
Please refer to the Aggregate Plan template in MS Excel.
Complete the model with the goal of minimizing costs while attempting to level load your production rates as much as possible. For your completed model, the backlog is required to be zero.
Variables:
- Subcontract supply (in units)
- Hiring/Firing Employees. The Model assuming current labour is set at 50. You can Hire/fire employees starting in February
- Running Overtime (in Hours)
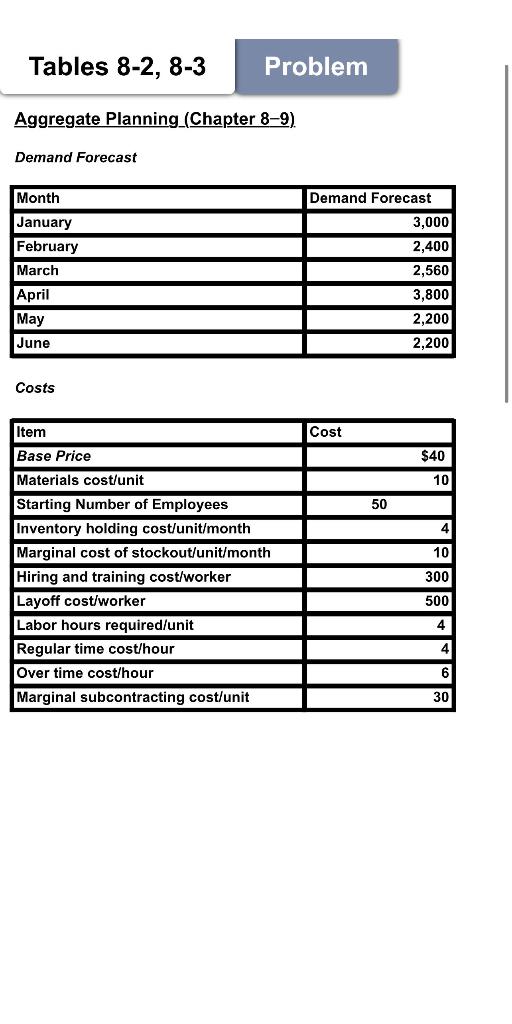
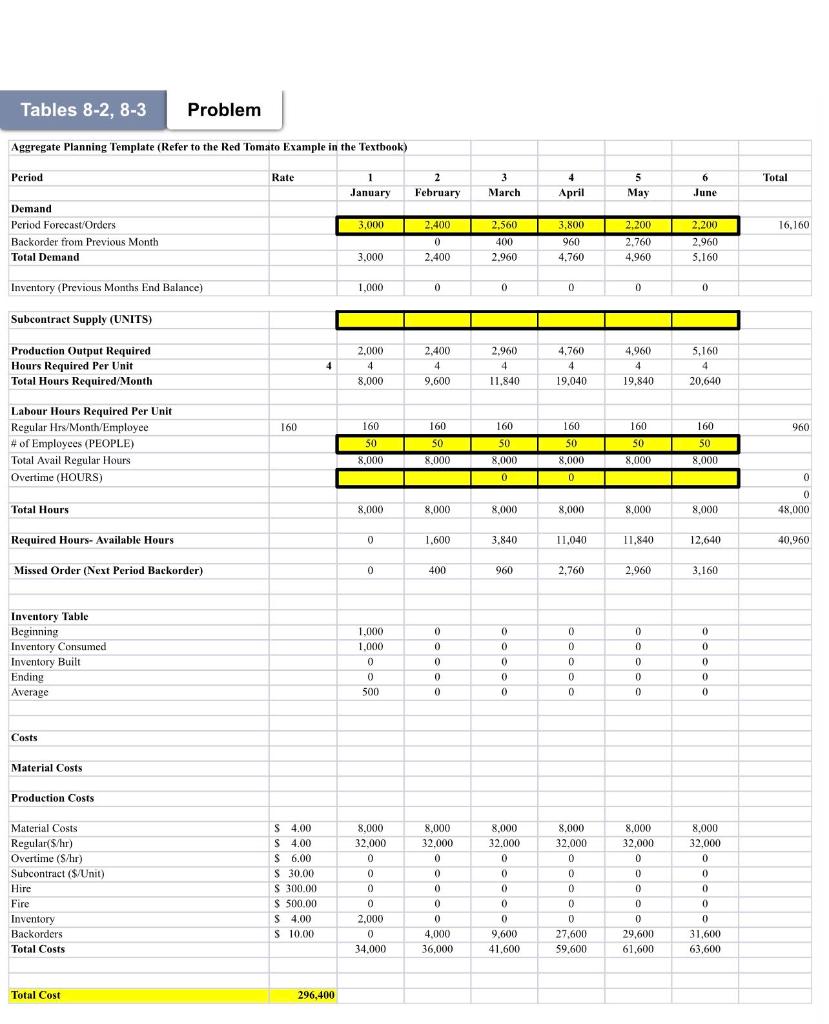
Tables 8-2, 8-3 Problem Aggregate Planning (Chapter 8-9) Demand Forecast Month January February March April | May June Demand Forecast 3,000 2,400 2,560 3,800 2,200 2,200 Costs Cost $40 10 50 4 10 Item Base Price Materials cost/unit Starting Number of Employees Inventory holding cost/unit/month Marginal cost of stockout/unit/month Hiring and training cost/worker Layoff cost/worker Labor hours required/unit Regular time cost/hour Over time cost/hour Marginal subcontracting cost/unit 300 500 4 4 6 30 Tables 8-2, 8-3 Problem Aggregate Planning Template (Refer to the Red Tomato Example in the Textbook) Period Rate 6 Total 1 January 2 February 3 March 4 April 5 May June 3,000 16,160 Demand Period Forecast/Orders Backorder from Previous Month Total Demand 2,400 0 2.400 2,560 400 2.960 3,800 960 4.760 2,200 2,760 4.960 2.200 2,960 5.160 3.000 Inventory (Previous Months End Balance) 1,000 0 0 0 0 0 0 Subcontract Supply (UNITS) 4.960) Production Output Required Hours Required Per Unit Total Hours Required/Month 4 2.000 4 8,000 2,400 4 9,600 2.960 4 11,840 4,760 4 19,040 4 19.840 5,160 4 20,640 160 160 160 160 160 160 960 Labour Hours Required Per Unit Regular Hrs/Month/Employee #of Employees (PEOPLE) Total Avail Regular Hours Overtime (HOURS) 160 50 8.000 50 50 50 50 8,000 50 3.000 0 8.000 8.000 8.000 0 0 Total Hours 8.000 8.000 8.000 0 48,000 8.000 8,000 8,000 Required Hours- Available Hours 0 1.600 3,840 11.040 11.840 12,640 40,960 Missed Order (Next Period Backorder) 0 400 960 2.760 2.960 3.160 0 0 0 0 Inventory Table Beginning Inventory Consumed Inventory Built Ending Average 0 1.000 1,000 0 0 500 0 0 0 0 0 0 0 0 0 0 0 0 0 0 0 0 0 0 0 0 0 0 Costs Material Costs Production Costs 8,000 32.000 0 8.000 32.000 8.000 32,000 0 Material Costs Regular S/hr) Overtime (S/hr) Subcontract (S/Unit) Hire Fire Inventory Backorders Total Costs S 4.00 $ 4.00 $ 6,00 S 30.00 S 300.00 $ 500.00 S 4.00 S 10.00 8,000 32,000 0 0 0 0 2,000 0 34.000 0 0 0 8.000 32.000 0 0 0 0 0 9,600 41,600 8,000 32.000 0 0 0 0 0 27,600 59.600 0 0 0 0 0 0 0 0 29,600 61,600 0 4.000 36,000 0 31,600 63,600 Total Cost 296,400 Tables 8-2, 8-3 Problem Aggregate Planning (Chapter 8-9) Demand Forecast Month January February March April | May June Demand Forecast 3,000 2,400 2,560 3,800 2,200 2,200 Costs Cost $40 10 50 4 10 Item Base Price Materials cost/unit Starting Number of Employees Inventory holding cost/unit/month Marginal cost of stockout/unit/month Hiring and training cost/worker Layoff cost/worker Labor hours required/unit Regular time cost/hour Over time cost/hour Marginal subcontracting cost/unit 300 500 4 4 6 30 Tables 8-2, 8-3 Problem Aggregate Planning Template (Refer to the Red Tomato Example in the Textbook) Period Rate 6 Total 1 January 2 February 3 March 4 April 5 May June 3,000 16,160 Demand Period Forecast/Orders Backorder from Previous Month Total Demand 2,400 0 2.400 2,560 400 2.960 3,800 960 4.760 2,200 2,760 4.960 2.200 2,960 5.160 3.000 Inventory (Previous Months End Balance) 1,000 0 0 0 0 0 0 Subcontract Supply (UNITS) 4.960) Production Output Required Hours Required Per Unit Total Hours Required/Month 4 2.000 4 8,000 2,400 4 9,600 2.960 4 11,840 4,760 4 19,040 4 19.840 5,160 4 20,640 160 160 160 160 160 160 960 Labour Hours Required Per Unit Regular Hrs/Month/Employee #of Employees (PEOPLE) Total Avail Regular Hours Overtime (HOURS) 160 50 8.000 50 50 50 50 8,000 50 3.000 0 8.000 8.000 8.000 0 0 Total Hours 8.000 8.000 8.000 0 48,000 8.000 8,000 8,000 Required Hours- Available Hours 0 1.600 3,840 11.040 11.840 12,640 40,960 Missed Order (Next Period Backorder) 0 400 960 2.760 2.960 3.160 0 0 0 0 Inventory Table Beginning Inventory Consumed Inventory Built Ending Average 0 1.000 1,000 0 0 500 0 0 0 0 0 0 0 0 0 0 0 0 0 0 0 0 0 0 0 0 0 0 Costs Material Costs Production Costs 8,000 32.000 0 8.000 32.000 8.000 32,000 0 Material Costs Regular S/hr) Overtime (S/hr) Subcontract (S/Unit) Hire Fire Inventory Backorders Total Costs S 4.00 $ 4.00 $ 6,00 S 30.00 S 300.00 $ 500.00 S 4.00 S 10.00 8,000 32,000 0 0 0 0 2,000 0 34.000 0 0 0 8.000 32.000 0 0 0 0 0 9,600 41,600 8,000 32.000 0 0 0 0 0 27,600 59.600 0 0 0 0 0 0 0 0 29,600 61,600 0 4.000 36,000 0 31,600 63,600 Total Cost 296,400