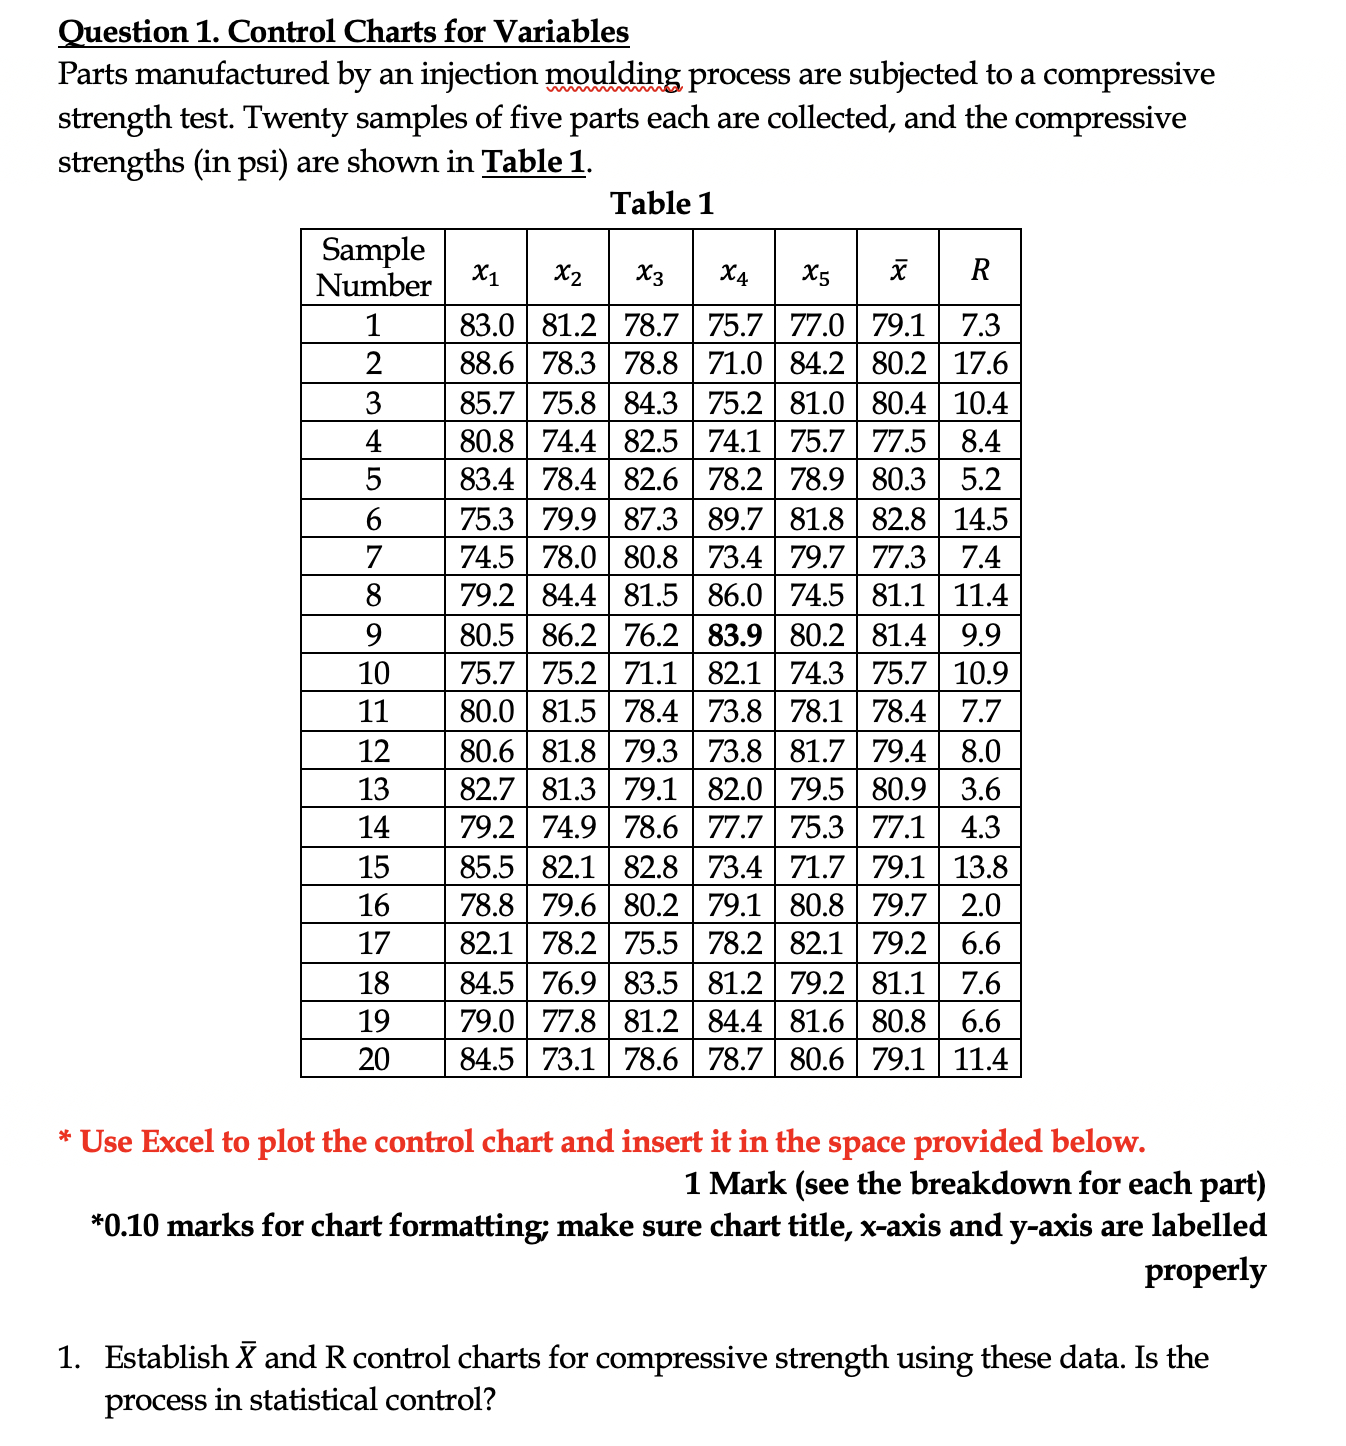
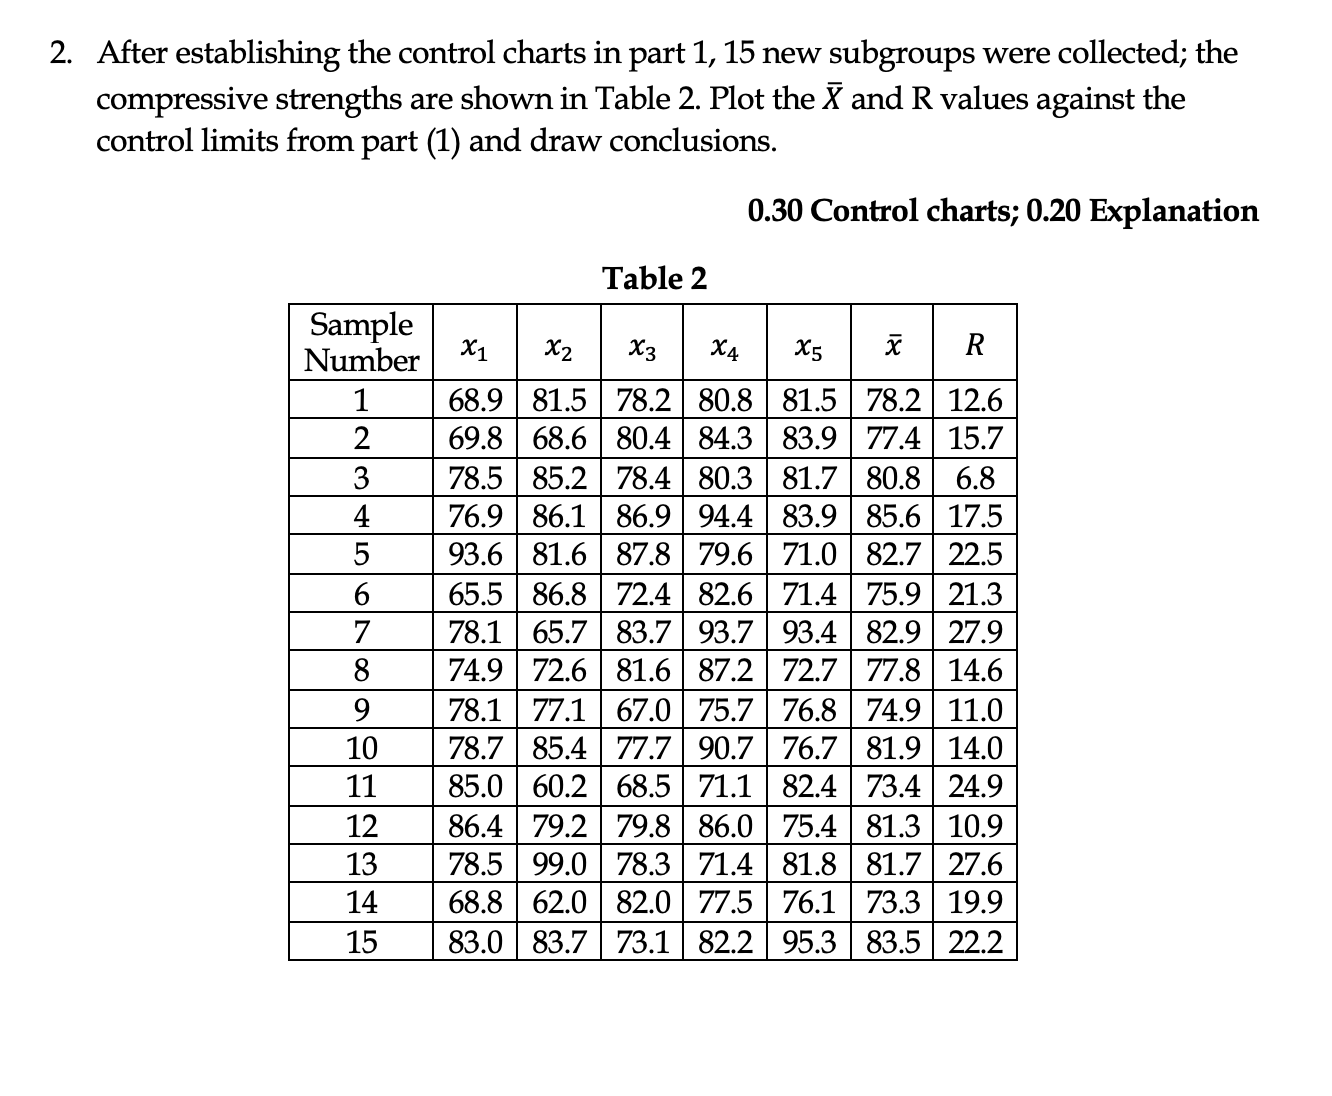
Question 1. Control Charts for Variables Parts manufactured by an injection moulding process are subjected to a compressive strength test. Twenty samples of five parts each are collected, and the compressive strengths (in psi) are shown in Table 1 Table 1 Sample Number X X2 X3 X4 X5 X R 1 83.0 81.2 78.7 75.7 77.0 79.1 7.3 2 88.6 78.3 78.8 |71.0 84.2 80.2 17.6 85.7 75.8 84.3 75.2 81.0 80.4 10.4 4 80.8 74.4 82.5 74.1 75.7 77.5 8.4 5 83.4 78.4 82.6 78.2 78.9 80.3 5.2 6 75.3 79.9 87.3 89.7 81.8 82.8 14.5 7 74.5 78.0 80.8 73.4 79.7 77.3 7.4 8 79.2 84.4 81.5 86.0 74.5 81.1 11.4 9 80.5 86.2 76.2 83.9 80.2 81.4 9.9 10 75.7 75.2 71.1 82.1 74.3 75.7 10.9 11 80.0 81.5 78.4 73.8 78.1 78.4 7.7 12 80.6 81.8 79.3 73.8 81.7 79.4 8.0 13 82.7 81.3 79.1 82.0 79.5 80.9 3.6 14 79.2 74.9 78.6 77.7 75.3 77.1 4.3 15 85.5 82.1 82.8 73.4 71.7 79.1 13.8 16 78.8 79.6 80.2 79.1 80.8 79.7 2.0 17 82.1 78.2 75.5 78.2 82.1 79.2 6.6 18 84.5 76.9 83.5 81.2 79.2 81.1 7.6 19 79.0 77.8 81.2 84.4 81.6 80.8 6.6 20 84.5 73.1 78.6 78.7 80.6 79.1 11.4 * Use Excel to plot the control chart and insert it in the space provided below. 1 Mark (see the breakdown for each part) *0.10 marks for chart formatting; make sure chart title, x-axis and y-axis are labelled properly 1. Establish X and R control charts for compressive strength using these data. Is the process in statistical control?2. After establishing the control charts in part 1, 15 new subgroups were collected; the compressive strengths are shown in Table 2. Plot the X and R values against the control limits from part (1) and draw conclusions. 0.30 Control charts; 0.20 Explanation Table 2 Sample Number X1 X2 X3 X4 X5 X R 1 68.9 81.5 78.2 80.8 81.5 78.2 12.6 2 69.8 68.6 80.4 84.3 83.9 77.4 15.7 78.5 85.2 78.4 80.3 81.7 80.8 6.8 76.9 86.1 86.9 94.4 83.9 85.6 17.5 93.6 81.6 87.8 79.6 71.0 82.7 22.5 6 65.5 86.8 72.4 82.6 71.4 75.9 21.3 78.1 65.7 83.7 93.7 93.4 82.9 27.9 74.9 72.6 81.6 87.2 72.7 77.8 14.6 9 78.1 77.1 67.0 |75.7 76.8 74.9 11.0 10 78.7 85.4 77.7 90.7 76.7 81.9 14.0 11 85.0 60.2 68.5 71.1 82.4 73.4 24.9 12 86.4 79.2 79.8 86.0 75.4 81.3 10.9 13 78.5 99.0 78.3 71.4 81.8 81.7 27.6 14 68.8 62.0 82.0 77.5 76.1 73.3 19.9 15 83.0 83.7 73.1 82.2 95.3 83.5 22.2Question 2. Control Charts for Variables Reconsider the data presented in Table 1 and Table 2. Establish 2? and 8 control charts for compressive strength using these data. Is the process in statistical control? Compare the values against the control limits establishes in the previous question and draw conclusions. 1 Mark * Use Excel to plot the control chart and insert it in the space provided below. 0.10 marks for chart formatting; 0.60 Control Charts; 0.30 Explanation