question 1.
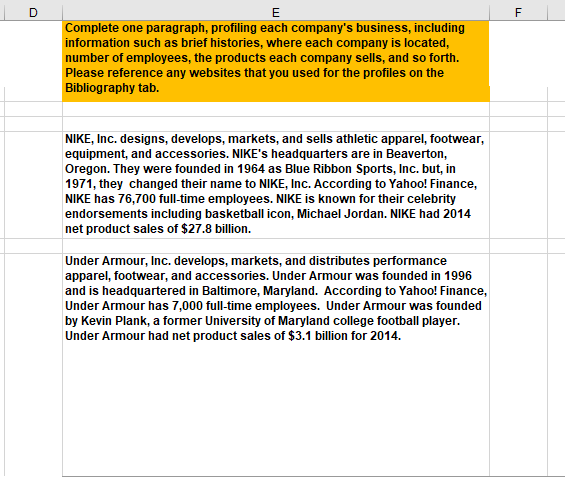
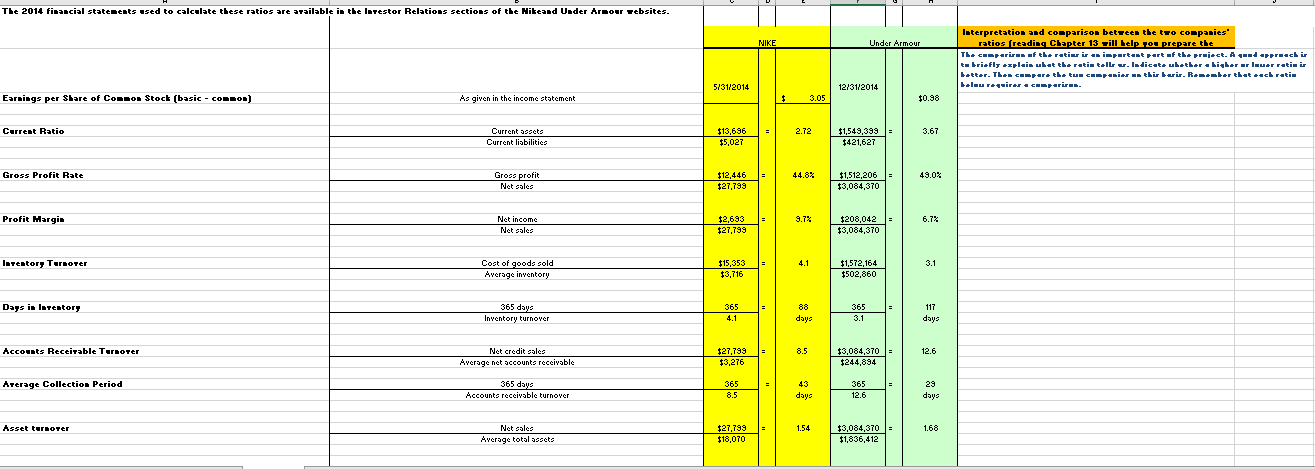
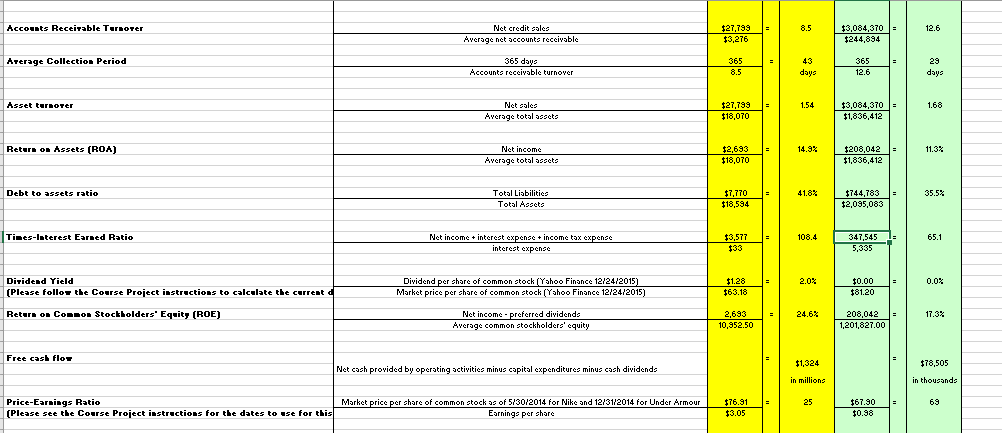
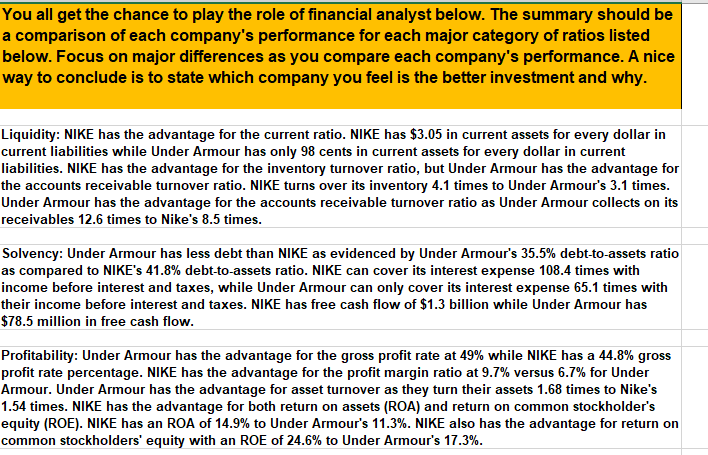
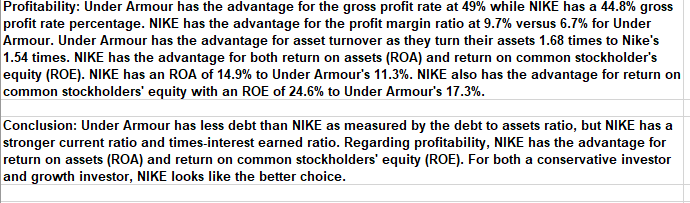
D F E Complete one paragraph, profiling each company's business, including information such as brief histories, where each company is located, number of employees, the products each company sells, and so forth. Please reference any websites that you used for the profiles on the Bibliography tab. NIKE, Inc. designs, develops, markets, and sells athletic apparel, footwear, equipment, and accessories. NIKE's headquarters are in Beaverton, Oregon. They were founded in 1964 as Blue Ribbon Sports, Inc. but, in 1971, they changed their name to NIKE, Inc. According to Yahoo! Finance, NIKE has 76,700 full-time employees. NIKE is known for their celebrity endorsements including basketball icon, Michael Jordan. NIKE had 2014 net product sales of $27.8 billion. Under Armour, Inc. develops, markets, and distributes performance apparel, footwear, and accessories. Under Armour was founded in 1996 and is headquartered in Baltimore, Maryland. According to Yahoo! Finance, Under Armour has 7,000 full-time employees. Under Armour was founded by Kevin Plank, a former University of Maryland college football player. Under Armour had net product sales of $3.1 billion for 2014. The 2014 financial statements used to calculate these ratios are available in the latestor Relations sections of the Hikeand Under Araour Tebsites. NIKE Under Armour Interpretation and co-parison betreen the tro companies' ratios (reading Chapter 13 vill help you prepare the The cuprir of the retiu ir aispartant part of the project. A precki t-briefly explain ubat the ratio tell v. Iudicet. uketker Ligher er louer retirir |+tk+r. Thrc-part th+turtiarth. Ramalar thattachruti | bleu requirere cuprires. 5/31/2014 12/31/2014 2342015 Earnings per Share of Connon Stock (basic - Connon) As given in the income statement $ 3.05 $0.98 Current Ratio 2.72 3.67 Current assets Current liabilities $13,636 $5,027 $1,549,399 $421,627 Gross Profit Rate 44.8% 49.0% Gross profit Net sales $12,446 $27,739 $1,512,206 $3,084,370 Profit Margin 9.7% 6.7% Nct income Net sales $2,693 $27,789 $208,042 $3,084,370 latestory Turnover 4.1 3.1 Cost of goods sold Average inventory $15,353 $3,716 $1,572,164 $502,860 Days in Inventory 365 days Inventory turnover 365 4.1 365 3.1 117 days days Accounts Receivable Turnover 8.5 12.6 Net credit sales Average not accounts receivable $27.799 $3,276 $3,084,370 $244,894 Average Collection Period 365 days Accounts receivable turnover 365 8.5 43 days 365 12.6 29 days Asset tur over 1.54 1.68 Net salad Average total assets $27,799 $18,070 $3,084,370- $1,836,412 $ Accounts Receivable Tarnoter 8.5 12.6 Net credit sales Average nct accounts receivabla $27.799 $3,276 $3,084,370 $244,834 Average Collection Period 365 days Accounts receivable turnover 365 8.5 43 days 365 12.6 29 days Asset tur over 1.54 1.68 Net sales Average total aggets $27.799 $18,070 $3,084,370 $1,836,412 Return on Assets (ROA) 14.9% Net income Average total asseto 14.92 11.37 $2,693 $18,070 $208,042 $1,836,412 Debt to assets ratio 41.8% 35.53 Total Liabilities Total Assets $7,770 $18,594 $744,783 $2,095,083 Times-laterest Earned Ratio 108.4 65.1 Net income interest expense + income tax expense interest expense $3,577 $33 347,545 5,335 2.0% 0.0% % Diridend Yield (Please follor the Course Project instructions to calculate the current Dividend per share of common stock (Yahoo Finance 12/24/2015) Market price per share of common stock (Yahoo Finance 12/24/2015) $1.28 $63.18 $0.00 $ $81.20 Return on Common Stockholders' Equity (ROE) 24.6% 17.3% Net income-preferred dividends Average common stockholders' equity 2,693 10,952.50 208,042 1.201,827.00 Free cash flow $1,324 $78,505 Net cash provided by operating activities minus capital expenditures minus cash dividends in millions in thousands 25 69 Price-Earnings Ratio (Pleast set the Course Project instructions for the dates to use for this Market price per share of common stock as of 5/30/2014 for Nike and 12/31/2014 for Under Armour Earning: per share $76.91 13.05 $67.30 $0.98 You all get the chance to play the role of financial analyst below. The summary should be a comparison of each company's performance for each major category of ratios listed below. Focus on major differences as you compare each company's performance. A nice way to conclude is to state which company you feel is the better investment and why. Liquidity: NIKE has the advantage for the current ratio. NIKE has $3.05 in current assets for every dollar in current liabilities while Under Armour has only 98 cents in current assets for every dollar in current liabilities. NIKE has the advantage for the inventory turnover ratio, but Under Armour has the advantage for the accounts receivable turnover ratio. NIKE turns over its inventory 4.1 times to Under Armour's 3.1 times. Under Armour has the advantage for the accounts receivable turnover ratio as Under Armour collects on its receivables 12.6 times to Nike's 8.5 times. Solvency: Under Armour has less debt than NIKE as evidenced by Under Armour's 35.5% debt-to-assets ratio as compared to NIKE's 41.8% debt-to-assets ratio. NIKE can cover its interest expense 108.4 times with income before interest and taxes, while Under Armour can only cover its interest expense 65.1 times with their income before interest and taxes. NIKE has free cash flow of $1.3 billion while Under Armour has $78.5 million in free cash flow. Profitability: Under Armour has the advantage for the gross profit rate at 49% while NIKE has a 44.8% gross profit rate percentage. NIKE has the advantage for the profit margin ratio at 9.7% versus 6.7% for Under Armour. Under Armour has the advantage for asset turnover as they turn their assets 1.68 times to Nike's 1.54 times. NIKE has the advantage for both return on assets (ROA) and return on common stockholder's equity (ROE). NIKE has an ROA of 14.9% to Under Armour's 11.3%. NIKE also has the advantage for return on common stockholders' equity with an ROE of 24.6% to Under Armour's 17.3%. Profitability: Under Armour has the advantage for the gross profit rate at 49% while NIKE has a 44.8% gross profit rate percentage. NIKE has the advantage for the profit margin ratio at 9.7% versus 6.7% for Under Armour. Under Armour has the advantage for asset turnover as they turn their assets 1.68 times to Nike's 1.54 times. NIKE has the advantage for both return on assets (ROA) and return on common stockholder's equity (ROE). NIKE has an ROA of 14.9% to Under Armour's 11.3%. NIKE also has the advantage for return on common stockholders' equity with an ROE of 24.6% to Under Armour's 17.3%. Conclusion: Under Armour has less debt than NIKE as measured by the debt to assets ratio, but NIKE has a stronger current ratio and times-interest earned ratio. Regarding profitability, NIKE has the advantage for return on assets (ROA) and return on common stockholders' equity (ROE). For both a conservative investor and growth investor, NIKE looks like the better choice. D F E Complete one paragraph, profiling each company's business, including information such as brief histories, where each company is located, number of employees, the products each company sells, and so forth. Please reference any websites that you used for the profiles on the Bibliography tab. NIKE, Inc. designs, develops, markets, and sells athletic apparel, footwear, equipment, and accessories. NIKE's headquarters are in Beaverton, Oregon. They were founded in 1964 as Blue Ribbon Sports, Inc. but, in 1971, they changed their name to NIKE, Inc. According to Yahoo! Finance, NIKE has 76,700 full-time employees. NIKE is known for their celebrity endorsements including basketball icon, Michael Jordan. NIKE had 2014 net product sales of $27.8 billion. Under Armour, Inc. develops, markets, and distributes performance apparel, footwear, and accessories. Under Armour was founded in 1996 and is headquartered in Baltimore, Maryland. According to Yahoo! Finance, Under Armour has 7,000 full-time employees. Under Armour was founded by Kevin Plank, a former University of Maryland college football player. Under Armour had net product sales of $3.1 billion for 2014. The 2014 financial statements used to calculate these ratios are available in the latestor Relations sections of the Hikeand Under Araour Tebsites. NIKE Under Armour Interpretation and co-parison betreen the tro companies' ratios (reading Chapter 13 vill help you prepare the The cuprir of the retiu ir aispartant part of the project. A precki t-briefly explain ubat the ratio tell v. Iudicet. uketker Ligher er louer retirir |+tk+r. Thrc-part th+turtiarth. Ramalar thattachruti | bleu requirere cuprires. 5/31/2014 12/31/2014 2342015 Earnings per Share of Connon Stock (basic - Connon) As given in the income statement $ 3.05 $0.98 Current Ratio 2.72 3.67 Current assets Current liabilities $13,636 $5,027 $1,549,399 $421,627 Gross Profit Rate 44.8% 49.0% Gross profit Net sales $12,446 $27,739 $1,512,206 $3,084,370 Profit Margin 9.7% 6.7% Nct income Net sales $2,693 $27,789 $208,042 $3,084,370 latestory Turnover 4.1 3.1 Cost of goods sold Average inventory $15,353 $3,716 $1,572,164 $502,860 Days in Inventory 365 days Inventory turnover 365 4.1 365 3.1 117 days days Accounts Receivable Turnover 8.5 12.6 Net credit sales Average not accounts receivable $27.799 $3,276 $3,084,370 $244,894 Average Collection Period 365 days Accounts receivable turnover 365 8.5 43 days 365 12.6 29 days Asset tur over 1.54 1.68 Net salad Average total assets $27,799 $18,070 $3,084,370- $1,836,412 $ Accounts Receivable Tarnoter 8.5 12.6 Net credit sales Average nct accounts receivabla $27.799 $3,276 $3,084,370 $244,834 Average Collection Period 365 days Accounts receivable turnover 365 8.5 43 days 365 12.6 29 days Asset tur over 1.54 1.68 Net sales Average total aggets $27.799 $18,070 $3,084,370 $1,836,412 Return on Assets (ROA) 14.9% Net income Average total asseto 14.92 11.37 $2,693 $18,070 $208,042 $1,836,412 Debt to assets ratio 41.8% 35.53 Total Liabilities Total Assets $7,770 $18,594 $744,783 $2,095,083 Times-laterest Earned Ratio 108.4 65.1 Net income interest expense + income tax expense interest expense $3,577 $33 347,545 5,335 2.0% 0.0% % Diridend Yield (Please follor the Course Project instructions to calculate the current Dividend per share of common stock (Yahoo Finance 12/24/2015) Market price per share of common stock (Yahoo Finance 12/24/2015) $1.28 $63.18 $0.00 $ $81.20 Return on Common Stockholders' Equity (ROE) 24.6% 17.3% Net income-preferred dividends Average common stockholders' equity 2,693 10,952.50 208,042 1.201,827.00 Free cash flow $1,324 $78,505 Net cash provided by operating activities minus capital expenditures minus cash dividends in millions in thousands 25 69 Price-Earnings Ratio (Pleast set the Course Project instructions for the dates to use for this Market price per share of common stock as of 5/30/2014 for Nike and 12/31/2014 for Under Armour Earning: per share $76.91 13.05 $67.30 $0.98 You all get the chance to play the role of financial analyst below. The summary should be a comparison of each company's performance for each major category of ratios listed below. Focus on major differences as you compare each company's performance. A nice way to conclude is to state which company you feel is the better investment and why. Liquidity: NIKE has the advantage for the current ratio. NIKE has $3.05 in current assets for every dollar in current liabilities while Under Armour has only 98 cents in current assets for every dollar in current liabilities. NIKE has the advantage for the inventory turnover ratio, but Under Armour has the advantage for the accounts receivable turnover ratio. NIKE turns over its inventory 4.1 times to Under Armour's 3.1 times. Under Armour has the advantage for the accounts receivable turnover ratio as Under Armour collects on its receivables 12.6 times to Nike's 8.5 times. Solvency: Under Armour has less debt than NIKE as evidenced by Under Armour's 35.5% debt-to-assets ratio as compared to NIKE's 41.8% debt-to-assets ratio. NIKE can cover its interest expense 108.4 times with income before interest and taxes, while Under Armour can only cover its interest expense 65.1 times with their income before interest and taxes. NIKE has free cash flow of $1.3 billion while Under Armour has $78.5 million in free cash flow. Profitability: Under Armour has the advantage for the gross profit rate at 49% while NIKE has a 44.8% gross profit rate percentage. NIKE has the advantage for the profit margin ratio at 9.7% versus 6.7% for Under Armour. Under Armour has the advantage for asset turnover as they turn their assets 1.68 times to Nike's 1.54 times. NIKE has the advantage for both return on assets (ROA) and return on common stockholder's equity (ROE). NIKE has an ROA of 14.9% to Under Armour's 11.3%. NIKE also has the advantage for return on common stockholders' equity with an ROE of 24.6% to Under Armour's 17.3%. Profitability: Under Armour has the advantage for the gross profit rate at 49% while NIKE has a 44.8% gross profit rate percentage. NIKE has the advantage for the profit margin ratio at 9.7% versus 6.7% for Under Armour. Under Armour has the advantage for asset turnover as they turn their assets 1.68 times to Nike's 1.54 times. NIKE has the advantage for both return on assets (ROA) and return on common stockholder's equity (ROE). NIKE has an ROA of 14.9% to Under Armour's 11.3%. NIKE also has the advantage for return on common stockholders' equity with an ROE of 24.6% to Under Armour's 17.3%. Conclusion: Under Armour has less debt than NIKE as measured by the debt to assets ratio, but NIKE has a stronger current ratio and times-interest earned ratio. Regarding profitability, NIKE has the advantage for return on assets (ROA) and return on common stockholders' equity (ROE). For both a conservative investor and growth investor, NIKE looks like the better choice