question 1: Footnote 10 indicates a defferred tax asset of $220 million.Footnote 7 indicates where on the balance sheet this amount is shown. Reconcile the amounts in the footnote 7 to the total deffered tax asset.
A) Deffered in come taxes include in other asset? $_
B) Deffered income taxes include in other liabilities? _
Question 2: Explain why 3M would have a deferred tax liability for "accelerated depreciation" ?
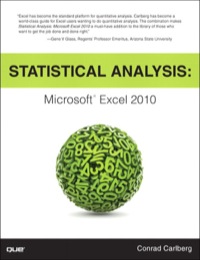
1 / 2 100% 2019 2018 S 3,008 % 3,487 S 2704 3,513 S 5,712 $ 7,000 $ 2017 4,149 3,399 7,548 2019 2018 2017 $ 534 $ 59 673 698 S 109 763 1,022 59 722 176 623 (32) (26) (78) 1,130 s (38) (17) (54) 1,637 S 162 15 76 2,679 $ NOTE 10. Income Taxes Income before Income Taxes illions nited States ternational Total Provision for Income Taxes (Millions) Currently payable Federal State International Tax Cuts and Jobs Act (TCJA) non-current transition tax provision Deferred Federal State International Total Components of Deferred Tax Assets and Liabilities Millions) Deferred tax assets: Accruals not currently deductible Employee benefit costs Product and other claims Miscellaneous accruals Pension costs Stock-based compensation Net operating/capital loss/tax credit carry forwards Foreign tax credits Inventory Other Gross deferred tax assets Valuation allowance Total deferred tax assets Deferred tax liabilities: Product and other insurance receivables Accelerated depreciation Intangible amortization Currency translation Other Total deferred tax liabilities Net deferred tax assets 2019 2018 S 187 228 113 643 203 71 169 280 119 824 218 150 66 70 113 2,009 (158) 1,851 54 24 1,523 (67) S S 1.456 s S (580) (1,021) (30) (7) (521) (799) (35) (8) (1,370) 86 S s (1,631) S 220 S The net deferred tax assets are included as components of Other Assets and Other Liabilities within the Consolidated Balance Sheet. See Note 7 Supplemental Balance Sheet Information for further details 2 / 2 100% NOTE 7. Supplemental Balance Sheet Information Additional supplemental balance sheet information is provided in the table that follows. Millions) 2019 2018 $ Other assets Deferred ihcome taxes Prepaid pension and post retirement Insurance related receivables and other Cash surrender value of life insurance policies Equity method investments Equity and other investments Other Total other assets 521 S 230 67 254 70 126 406 1,674 S 365 208 68 251 70 118 265 1,345 Other liabilities Accrued income taxes -- long-term portion Employee benefits Contingent liability claims and other Finance lease obligations Deferred income taxes Other Total other liabilities 1,507S 312 787 111 301 257 3,275 S 1,274 299 789 75 279 294 3.010 As of December 31, 2019, the Company had tax effected operating losses, capital losses, and tax credit carryovers for federal (approximately S82 million), state (approximately $79 million), and international (approximately S55 million), with all amounts before limitation impacts and valuation allowances. Federal tax attribute carryovers will expire after one to 10 years, the state after one to 11 years, and the interational after one year to an indefinite carryover period. As of December 31, 2019, the Company has provided $158 million of valuation allowance against certain of these deferred tax assets based on management's determination that it is more likely than-not that the tax benefits related to these assets will not be realized. Reconciliation of Effective Income Tax Rate 2019 2018 2017 Statutory U.S. tax rate 21.0 % 21.0% State income taxes - net of federal benefit 35.0 % 1.0 International income taxes-net 0.8 0.2 0.2 Global Intangible Low Taxed Income (GILTI) (6.3) 1.8 1.1 Foreign Derived Intangible Income (FDII) U.S. TCJA enactment - net impacts (2.9) (1.3) U.S. research and development credit 2.5 10.1 Reserves for tax contingencies (1.7) (1.5) (0.7) Domestic Manufacturer's deduction 2.3 1.2 2.2 Employee share-based payments (1.8) All other - net (1.3) (1.4) (3.2) Effective worldwide tax rate (0.1) 0.6 (0,6 19.8 % 23.4 % 35.5 % 0.5