Question 1
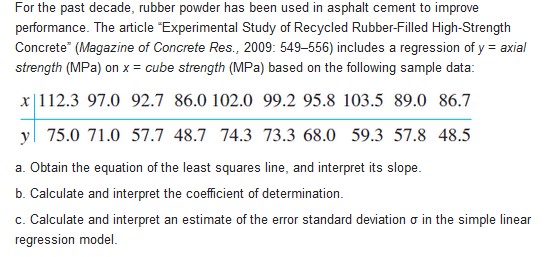
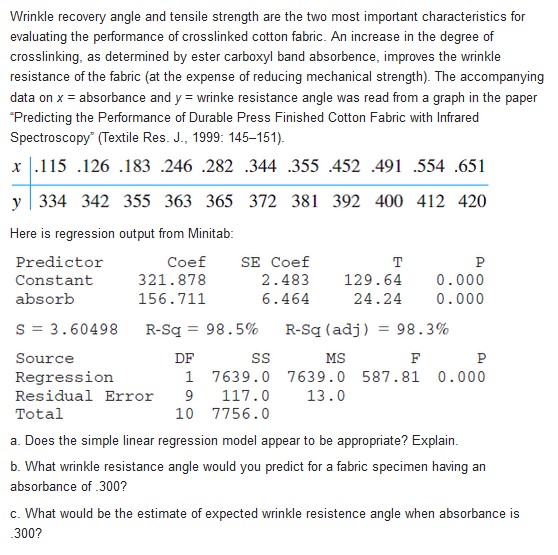
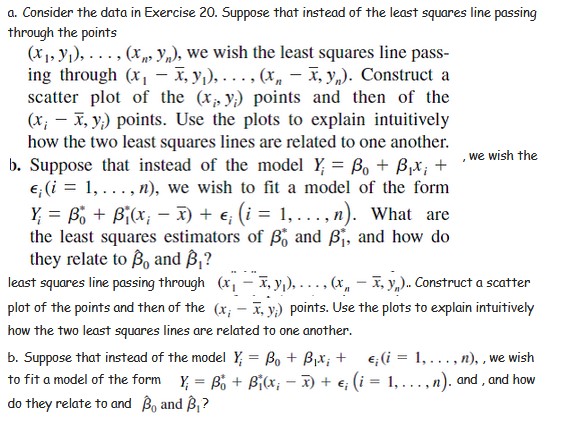
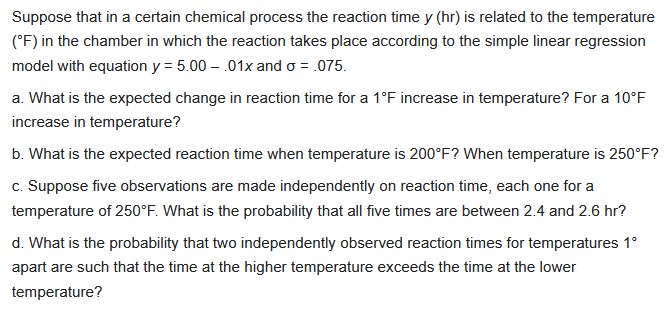
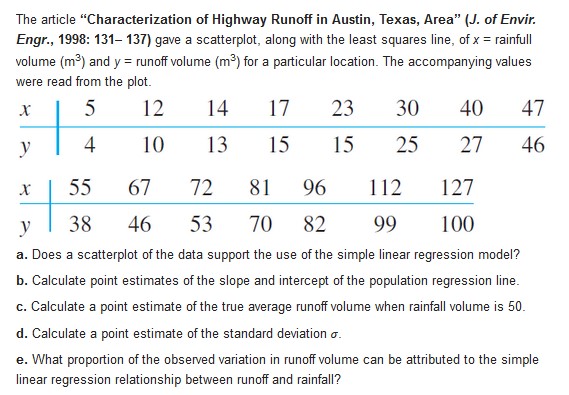
For the past decade, rubber powder has been used in asphalt cement to improve performance. The article "Experimental Study of Recycled Rubber-Filled High-Strength Concrete" (Magazine of Concrete Res., 2009: 549-556) includes a regression of y = axial strength (MPa) on x = cube strength (MPa) based on the following sample data: x 112.3 97.0 92.7 86.0 102.0 99.2 95.8 103.5 89.0 86.7 y | 75.0 71.0 57.7 48.7 74.3 73.3 68.0 59.3 57.8 48.5 a. Obtain the equation of the least squares line, and interpret its slope. b. Calculate and interpret the coefficient of determination. c. Calculate and interpret an estimate of the error standard deviation o in the simple linear regression model.Wrinkle recovery angle and tensile strength are the two most important characteristics for evaluating the performance of crosslinked cotton fabric. An increase in the degree of crosslinking, as determined by ester carboxyl band absorbence, improves the wrinkle resistance of the fabric (at the expense of reducing mechanical strength). The accompanying data on x = absorbance and y = wrinke resistance angle was read from a graph in the paper "Predicting the Performance of Durable Press Finished Cotton Fabric with Infrared Spectroscopy" (Textile Res. J., 1999: 145-151). x .115 .126 .183 .246 .282 .344 .355 .452 .491 .554 .651 y 334 342 355 363 365 372 381 392 400 412 420 Here is regression output from Minitab: Predictor Coef SE Coef T P Constant 321 . 878 2.483 129 .64 0. 000 absorb 156. 711 6. 464 24.24 0. 000 S = 3. 60498 R-Sq = 98.5% R-Sq (adj ) = 98.3% Source DF SS MS F P Regression 1 7639.0 7639.0 587.81 0.000 Residual Error 9 117.0 13.0 Total 0 7756.0 a. Does the simple linear regression model appear to be appropriate? Explain. b. What wrinkle resistance angle would you predict for a fabric specimen having an absorbance of .300? c. What would be the estimate of expected wrinkle resistence angle when absorbance is 300?a. Consider the data in Exercise 20. Suppose that instead of the least squares line passing through the points (X1, ),), . . .. (x, , y,), we wish the least squares line pass- ing through (x, - x, y,), . . . . (X, - X, y,,). Construct a scatter plot of the (x;, y,) points and then of the (x; - x, y.) points. Use the plots to explain intuitively how the two least squares lines are related to one another. b. Suppose that instead of the model Y, = Bo + Bix; + . we wish the E, (i = 1, . . ., n), we wish to fit a model of the form Y = Bo + Bj (x; - x) + e; (i = 1,..., n). What are the least squares estimators of B; and B;, and how do they relate to Bo and B,? least squares line passing through (x, - X, y,). .... (x,, - X, y,).. Construct a scatter plot of the points and then of the (x; - X, y.) points. Use the plots to explain intuitively how the two least squares lines are related to one another. b. Suppose that instead of the model Y, = Bo + Bix; + e; (i = 1, . ... n), , we wish to fit a model of the form Y = B; + Bj(x, - D) + e; (i = 1, .... "). and , and how do they relate to and Bo and B,?Suppose that in a certain chemical process the reaction time 1; {hr} is related to the temperature [\"F] in the chamber in which the reaction takes place according to the simple linear regression model with equation 1;: 5.0-0 .1x and o = .t}?5_ a. What is the expected change in reaction time for a 1"F increase in temperature? For a 1{lF increase in temperature?I b. What is the expected reaction time when temperature is EDITF? When temperature is 25D"F? c. Suppose ve observations are made independently on reaction time, each one for a temperature of 25"F_ What is the probability that all ve times are between 2.4 and 2.6 hr? d. What is the probability that two independently observed reaction times for temperatures 1\" apart are such that the time at the higher temperature exceeds the time at the lower temperature? The accompanying data on x = current density (mA/cm2) and y = rate of deposition (um/min Jappeared in the article "Plating of 60/40 Tin/Lead Solder for Head Termination Metallurgy" (Plating and Surface Finishing, Jan. 1997: 38-40). Do you agree with the claim by the article's author that "a linear relationship was obtained from the tin-lead rate of deposition as a function of current density"? Explain your reasoning. (um/min )The article "Characterization of Highway Runoff in Austin, Texas, Area" (J. of Envir Engr., 1998: 131-137) gave a scatterplot, along with the least squares line, of x = rainfull volume (m ) and y = runoff volume (m ) for a particular location. The accompanying values were read from the plot. X U 12 14 17 23 30 40 47 4 10 13 15 15 25 27 46 55 67 72 81 96 112 127 38 46 53 70 82 99 100 a. Does a scatterplot of the data support the use of the simple linear regression model? b. Calculate point estimates of the slope and intercept of the population regression line. c. Calculate a point estimate of the true average runoff volume when rainfall volume is 50. d. Calculate a point estimate of the standard deviation o. e. What proportion of the observed variation in runoff volume can be attributed to the simple linear regression relationship between runoff and rainfall
