

Answered step by step
Verified Expert Solution
Question
1 Approved Answer
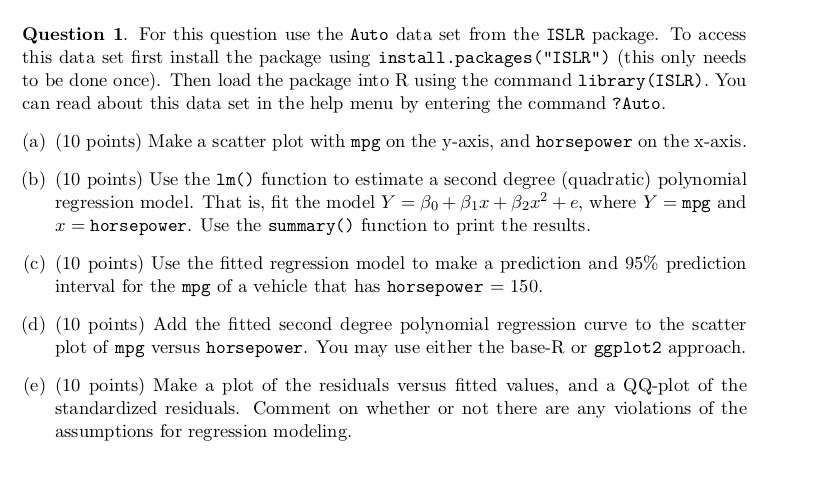
Question 1. For this question use the Auto data set from the ISLR package. To access this data set first install the package using install.packages
Step by Step Solution
There are 3 Steps involved in it
Step: 1

Get Instant Access to Expert-Tailored Solutions
See step-by-step solutions with expert insights and AI powered tools for academic success
Step: 2

Step: 3
Ace Your Homework with AI
Get the answers you need in no time with our AI-driven, step-by-step assistance
Get Started
Beginning Databases With PostgreSQL From Novice To Professional
Authors: Richard Stones, Neil Matthew
2nd Edition
1590594789, 978-1590594780