

Question
Question 1: I don't understand why this is incorrect. It should be the sum of all numbers in the PV column. Can you help me
Question 1: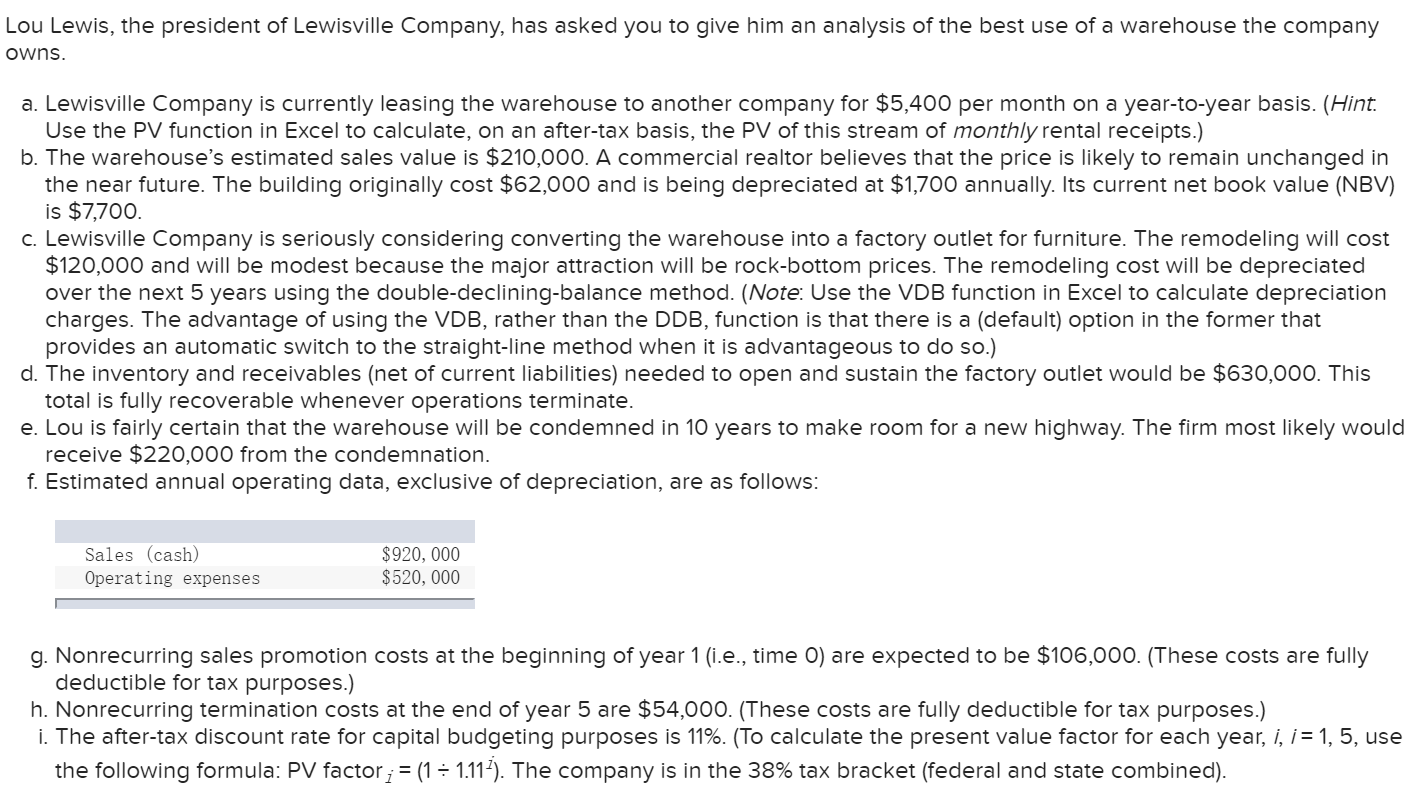
 I don't understand why this is incorrect. It should be the sum of all numbers in the PV column. Can you help me find what is the correct answer to this
question 2:

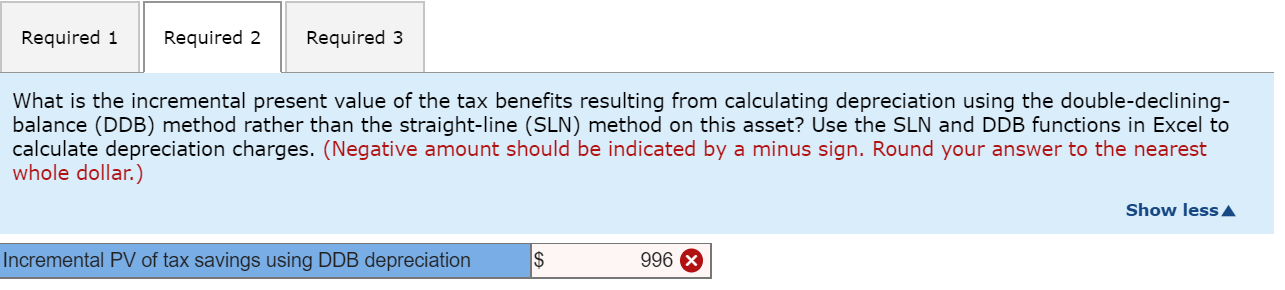


for this question I tried all of the numbers either positive or negative, all are wrong. can you give me the correct answer? I post the question twice already. on one has the correct answer
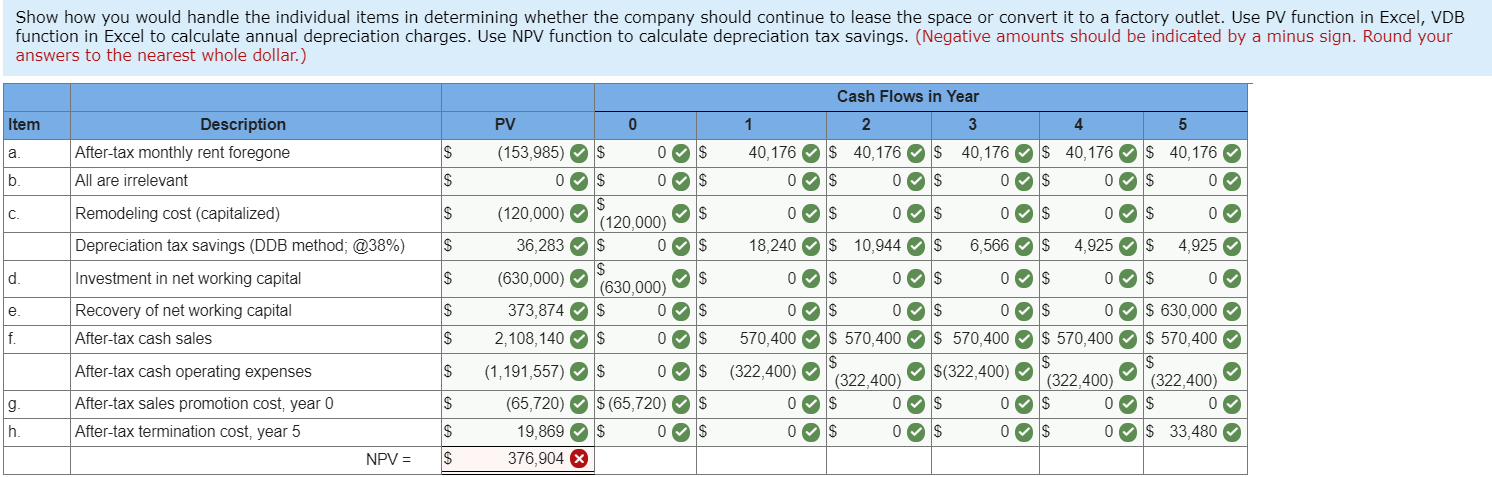
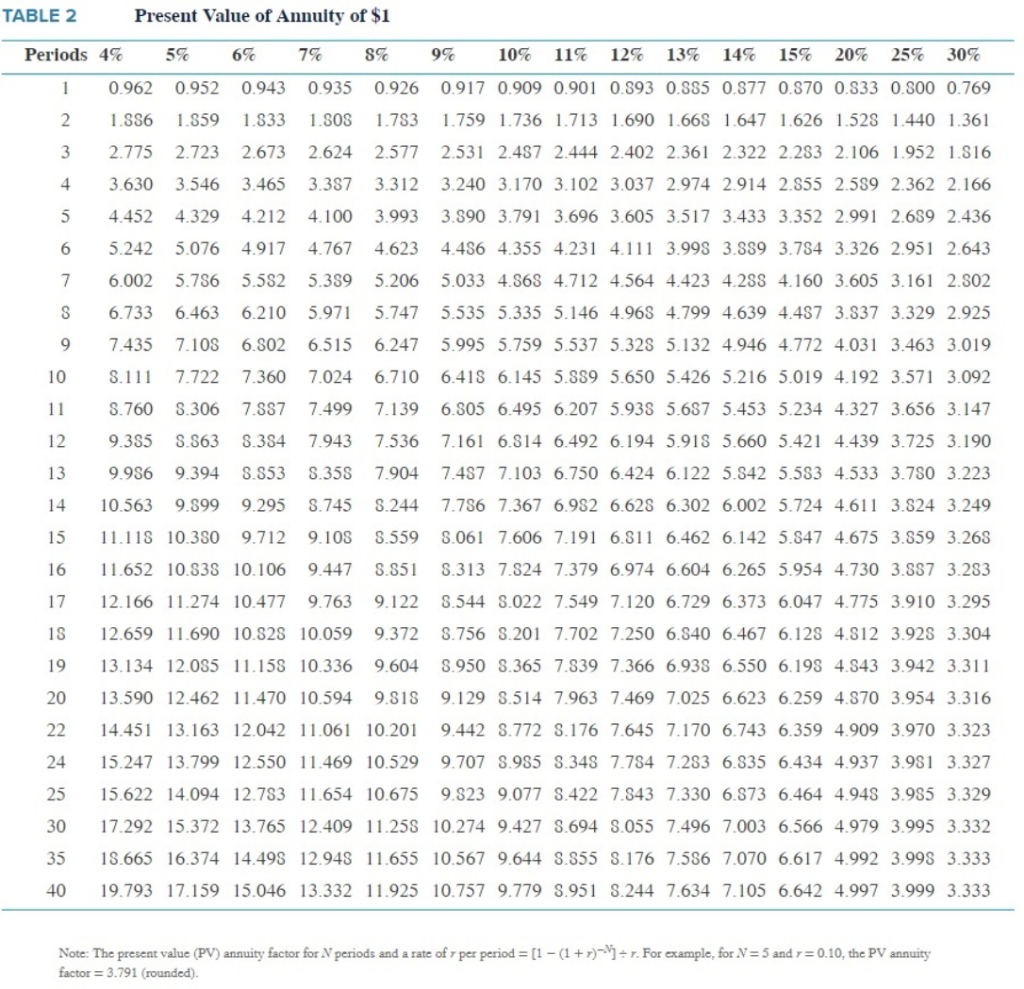
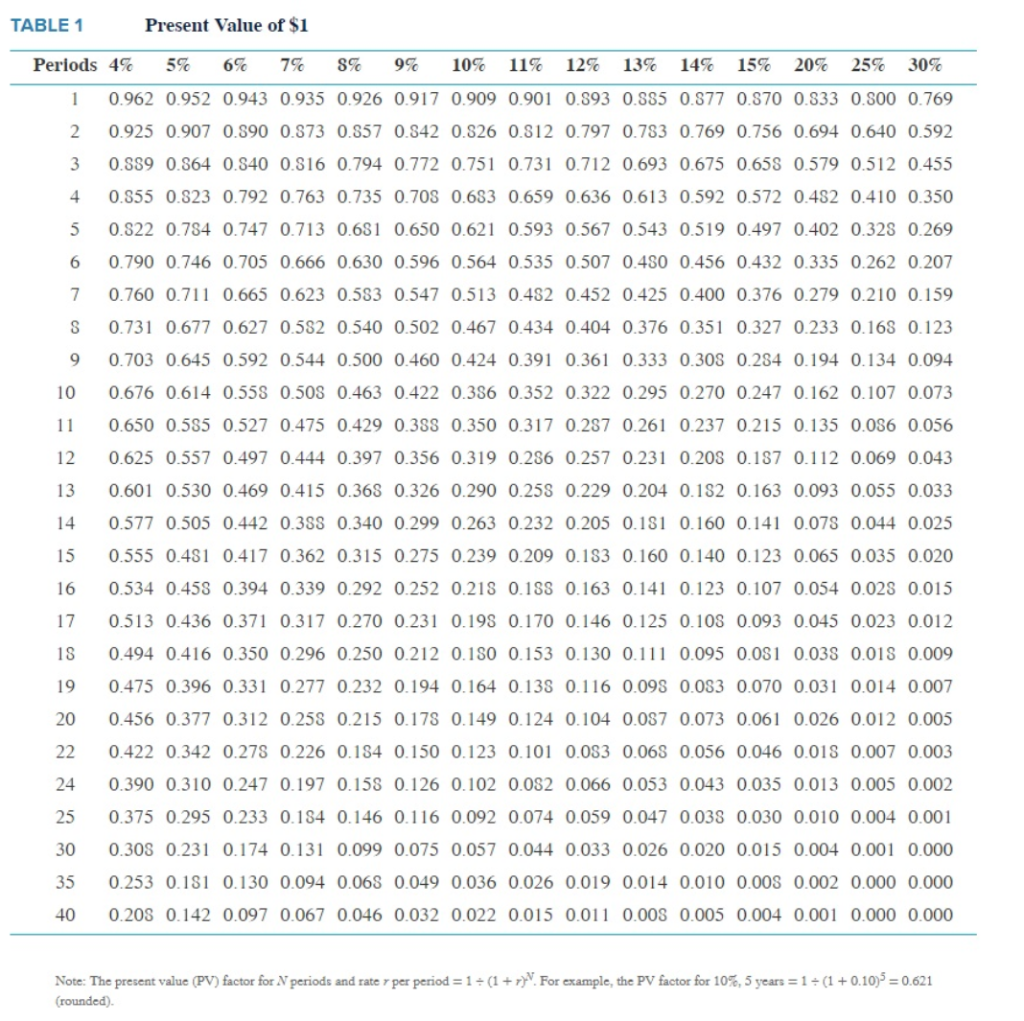
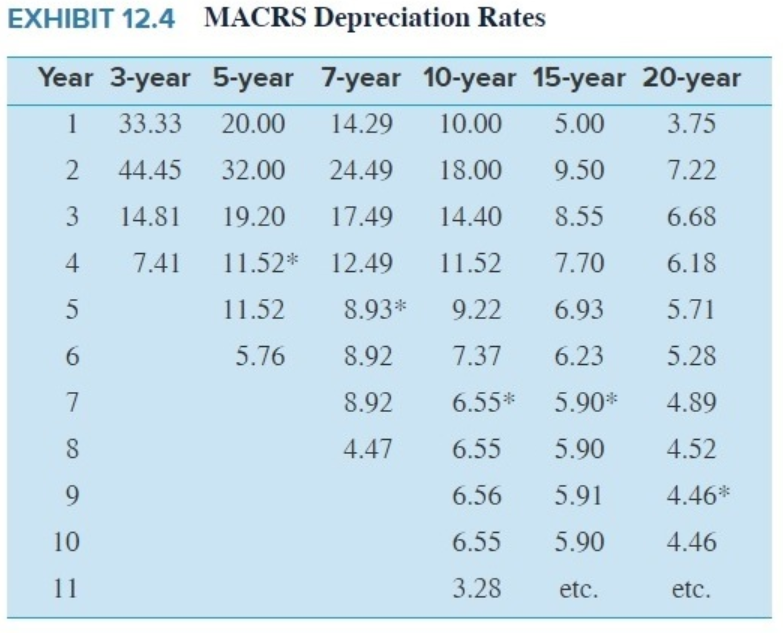
Lou Lewis, the president of Lewisville Company, has asked you to give him an analysis of the best use of a warehouse the company owns. a. Lewisville Company is currently leasing the warehouse to another company for $5,400 per month on a year-to-year basis. (Hint. Use the PV function in Excel to calculate, on an after-tax basis, the PV of this stream of monthly rental receipts.) b. The warehouse's estimated sales value is $210,000. A commercial realtor believes that the price is likely to remain unchanged in the near future. The building originally cost $62,000 and is being depreciated at $1,700 annually. Its current net book value (NBV) is $7,700. c. Lewisville Company is seriously considering converting the warehouse into a factory outlet for furniture. The remodeling will cost $120,000 and will be modest because the major attraction will be rock-bottom prices. The remodeling cost will be depreciated over the next 5 years using the double-declining-balance method. (Note: Use the VDB function in Excel to calculate depreciation charges. The advantage of using the VDB, rather than the DDB, function is that there is a (default) option in the former that provides an automatic switch to the straight-line method when it is advantageous to do so.) d. The inventory and receivables (net of current liabilities) needed to open and sustain the factory outlet would be $630,000. This total is fully recoverable whenever operations terminate. e. Lou is fairly certain that the warehouse will be condemned in 10 years to make room for a new highway. The firm most likely would receive $220,000 from the condemnation. f. Estimated annual operating data, exclusive of depreciation, are as follows: Sales (cash) Operating expenses $920,000 $520,000 g. Nonrecurring sales promotion costs at the beginning of year 1 (i.e., time 0) are expected to be $106,000. (These costs are fully deductible for tax purposes.) h. Nonrecurring termination costs at the end of year 5 are $54,000. (These costs are fully deductible for tax purposes.) i. The after-tax discount rate for capital budgeting purposes is 11%. (To calculate the present value factor for each year, i, i = 1, 5, use the following formula: PV factor ; = (1 = 1.114). The company is in the 38% tax bracket (federal and state combined). Show how you would handle the individual items in determining whether the company should continue to lease the space or convert it to a factory outlet. Use PV function in Excel, VDB function in Excel to calculate annual depreciation charges. Use NPV function to calculate depreciation tax savings. (Negative amounts should be indicated by a minus sign. Round your answers to the nearest whole dollar.) Item Description After-tax monthly rent foregone All are irrelevant $ b. S S Remodeling cost (capitalized) Depreciation tax savings (DDB method; @38%) Investment in net working capital Recovery of net working capital Cash Flows in Year PV 0 1 2 3 4 5 (153,985) $ 0 $ 40,176 $ 40,176 $ 40,176 $ 40,176 $ 40,176 0S 0S 0S 0S 0S 0S 0 (120,000) 14120.000, $ 0S 0S 0S 0S 0% 36,283 S 0 $ 18,240 $ 10,944 $ 6,566 $ 4,925 $ 4,925 (630,000) 620 000S 0S 0S 0S 0S 0 373,874 $ 0 0S 0S 0S 0S 630,000 2,108,140S 0 S 570,400 $ 570,400 $ 570,400 $ 570,400 $ 570,400 (1,191,557) $ 00$ (322,400) 1322.400 $(322,400) 1322.400) 322.400) (65,720) $ (65,720) $ 0S 0S 0S 0S 0 19,869 $ 0 $ 00S 00S 0S 0S 33,480 376,904 f After-tax cash sales $ $ $ $ After-tax cash operating expenses After-tax sales promotion cost, year 0 After-tax termination cost, year 5 NPV = $ Freedom Corporation acquired a fixed asset for $220,000. Its estimated life at time of purchase was 4 years, with no estimated salvage value. Assume a discount rate of 7% and an income tax rate of 40%. (Use Exhibit 12.4, Appendix C, TABLE 1 and Appendix C, TABLE 2.) TABLE2 Present Value of Annuity of $1 Periods 4% 5% 6% 7% 8% 9% 10% 11% 12% 13% 14% 15% 20% 25% 30% 1 0.962 0.952 0.943 0.935 0.926 0.917 0.909 0.901 0.893 0.585 0.377 0.870 0.333 0.800 0.769 1.556 1.559 1.533 1.308 1.783 1.759 1.736 1.713 1.690 1.665 1.647 1.626 1.528 1.440 1.361 3 2.775 2.723 2.673 2.624 2.577 2.531 2.487 2.444 2.402 2.361 2.322 2.283 2.106 1.952 1.516 4 3.630 3.546 3.465 3.357 3.312 3.240 3.170 3.102 3.037 2.974 2.914 2.355 2.539 2.362 2.166 5 4.452 4.329 4.212 4.100 3.993 3.390 3.791 3.696 3.605 3.517 3.433 3.352 2.991 2.659 2.436 6 5.242 5.076 4.917 4.767 4.623 4.456 4.355 4.231 4.111 3.999 3.889 3.784 3.326 2.951 2.643 7 6.002 5.756 5.582 5.389 5.206 5.033 4.568 4.712 4.564 4.423 4.288 4.160 3.605 3.161 2.502 8 6.733 6.463 6.210 5.971 5.747 5.535 5.335 5.146 4.96S 4.799 4.639 4.437 3.837 3.329 2.925 9 7.435 7.108 6.802 6.515 6.247 5.995 5.759 5.537 5.328 5.132 4.946 4.772 4.031 3.463 3.019 10 3.111 7.722 7.360 7.024 6.710 6.418 6.145 5.889 5.650 5.426 5.216 5.019 4.192 3.571 3.092 11 3 .760 8.306 7.887 7.499 7.139 6.305 6.495 6.207 5.939 5.687 5.453 5.234 4.327 3.656 3.147 12 9.355 8.563 3.354 7.943 7.536 7.161 6.814 6.492 6.194 5.915 5.660 5.421 4.439 3.725 3.190 13 9.986 9.394 8.553 .358 7.904 7.487 7.103 6.750 6.424 6.122 5.342 5.583 4.533 3.750 3.223 14 10.563 9.399 9.295 3.745 8.244 7.786 7.367 6.982 6.628 6.302 6.002 5.724 4.611 3.824 3.249 15 11.115 10.350 9.712 9.108 3.559 8.061 7.606 7.191 6.511 6.462 6.142 5.347 4.675 3.859 3.268 16 11.652 10.538 10.106 9.447 3.851 .313 7.824 7.379 6.974 6.604 6.265 5.954 4.730 3.857 3.283 17 12.166 11.274 10.477 9.763 9.122 8.544 3.022 7.549 7.120 6.729 6.373 6.047 4.775 3.910 3.295 18 12.659 11.690 10.328 10.059 9.372 8.756 3.201 7.702 7.250 6.540 6.467 6.125 4.812 3.928 3.304 19 1 3.134 12.055 11.158 10.336 9.604 3.950 .365 7.539 7.366 6.938 6.550 6.198 4.543 3.942 3.311 20 13.590 12.462 11.470 10.594 9.818 9.129 8.514 7.963 7.469 7.025 6.623 6.259 4.570 3.954 3.316 14.451 13.163 12.042 11.061 10.201 9.442 3.772 .176 7.645 7.170 6.743 6.359 4.909 3.970 3.323 24 15.247 13.799 12.550 11.469 10.529 9.707 8.985 .343 7.784 7.283 6.835 6.434 4.937 3.981 3.327 15.622 14.094 12.783 11.654 10.675 9.3239.077 3.422 7.543 7.330 6.373 6.464 4.948 3.985 3.329 30 17.292 15.372 13.765 12.409 11.258 10.274 9.427 5.694 5.055 7.496 7.003 6.566 4.979 3.995 3.332 35 15.665 16.374 14.498 12.948 11.655 10.567 9.644 3.355 3.176 7.586 7.070 6.617 4.992 3.999 3.333 40 19.793 17.159 15.046 13.332 11.925 10.757 9.779 5.951 8.244 7.634 7.105 6.642 4.997 3.999 3.333 Note: The present value (PV) annuity factor for N periods and a rate of r per period = [1 - (1 + r)-V) = r. For example, for N = 5 and r=0.10, the PV annuity factor = 3.791 (rounded). TABLE 1 Present Value of $1 Periods 4% 5% 6% 7% 8% 9% 10% 11% 12% 13% 14% 15% 20% 25% 30% 1 0.962 0.952 0.943 0.935 0.926 0.917 0.909 0.901 0.893 0.585 0.877 0.870 0.833 0.500 0.769 2 0.925 0.907 0.590 0.373 0.557 0.542 0.826 0.812 0.797 0.783 0.769 0.756 0.694 0.640 0.592 3 0.889 0.864 0.540 0.816 0.794 0.772 0.751 0.731 0.712 0.693 0.675 0.655 0.579 0.512 0.455 4 0.355 0.823 0.792 0.763 0.735 0.708 0.683 0.659 0.636 0.613 0.592 0.572 0.482 0.410 0.350 5 0.522 0.784 0.747 0.713 0.681 0.650 0.621 0.593 0.567 0.543 0.519 0.497 0.402 0.328 0.269 6 0.790 0.746 0.705 0.666 0.630 0.596 0.564 0.535 0.507 0.480 0.456 0.432 0.335 0.262 0.207 7 0.760 0.711 0.665 0.623 0.583 0.547 0.513 0.482 0.452 0.425 0.400 0.376 0.279 0.210 0.159 S 0.731 0.677 0.627 0.582 0.540 0.502 0.467 0.434 0.404 0.376 0.351 0.327 0.233 0.163 0.123 9 0.703 0.645 0.592 0.544 0.500 0.460 0.424 0.391 0.361 0.333 0.308 0.284 0.194 0.134 0.094 10 0.676 0.614 0.558 0.508 0.463 0.422 0.356 0.352 0.322 0.295 0.270 0.247 0.162 0.107 0.073 0.650 0.585 0.527 0.475 0.429 0.383 0.350 0.317 0.287 0.261 0.237 0.215 0.135 0.036 0.056 0.625 0.557 0.497 0.444 0.397 0.356 0.319 0.286 0.257 0.231 0.208 0.187 0.112 0.069 0.043 13 0.601 0.530 0.469 0.415 0.368 0.326 0.290 0.25% 0.229 0.204 0.182 0.163 0.093 0.055 0.033 0.577 0.505 0.442 0.388 0.340 0.299 0.263 0.232 0.205 0.181 0.160 0.141 0.078 0.044 0.025 15 0.555 0.481 0.417 0.362 0.315 0.275 0.239 0.209 0.183 0.160 0.140 0.123 0.065 0.035 0.020 16 0.534 0.458 0.394 0.339 0.292 0.252 0.218 0.18 0.163 0.141 0.123 0.107 0.054 0.028 0.015 0.513 0.436 0.371 0.317 0.270 0.231 0.198 0.170 0.146 0.125 0.105 0.093 0.045 0.023 0.012 18 0.494 0.416 0.350 0.296 0.250 0.212 0.150 0.153 0.130 0.111 0.095 0.081 0.035 0.018 0.009 190.475 0.396 0.331 0.277 0.232 0.194 0.164 0.138 0.116 0.098 0.083 0.070 0.031 0.014 0.007 20 0.456 0.377 0.312 0.25% 0.215 0.178 0.149 0.124 0.104 0.087 0.073 0.061 0.026 0.012 0.005 22 0.422 0.342 0.278 0.226 0.184 0.150 0.123 0.101 0.053 0.068 0.056 0.046 0.018 0.007 0.003 24 0.390 0.310 0.247 0.197 0.158 0.126 0.102 0.082 0.066 0.053 0.043 0.035 0.013 0.005 0.002 25 0.375 0.295 0.233 0.134 0.146 0.116 0.092 0.074 0.059 0.047 0.035 0.030 0.010 0.004 0.001 30 0.308 0.231 0.174 0.131 0.099 0.075 0.057 0.044 0.033 0.026 0.020 0.015 0.004 0.001 0.000 0.253 0.151 0.130 0.094 0.068 0.049 0.036 0.026 0.019 0.014 0.010 0.008 0.002 0.000 0.000 40 0.205 0.142 0.097 0.067 0.046 0.032 0.022 0.015 0.011 0.005 0.005 0.004 0.001 0.000 0.000 Note: The present value (PV) factor for N periods and rate per period = 1 = (1 + r) For example, the PV factor for 10%, 5 years = 1 = (1 + 0.10% = 0.621 (rounded) EXHIBIT 12.4 MACRS Depreciation Rates Year 3-year 5-year 7-year 10-year 15-year 20-year 1 33.33 20.00 14.29 10.00 5.00 3.75 2 44.45 32.00 24.49 18.00 9.50 7.22 3 14.81 19.20 17.49 14.40 8.55 6.68 4 7.41 11.52* 12.49 11.52 7.70 6.18 11.52 8.93* 9.22 6.93 5.71 5.76 8.92 7.37 6.23 5.28 8.92 6.55* 5.90* 4.89 4.47 6.55 5.90 4.52 6.56 5.91 4.46% 6.55 5.90 4.46 3.28 etc. etc. Required 1 Required 2 Required 3 What is the incremental present value of the tax benefits resulting from calculating depreciation using the double-declining- balance (DDB) method rather than the straight-line (SLN) method on this asset? Use the SLN and DDB functions in Excel to calculate depreciation charges. (Negative amount should be indicated by a minus sign. Round your answer to the nearest whole dollar.) Show less Incremental PV of tax savings using DDB depreciation 996 X Incremental PV of tax savings using DDB depreciation s (996) Incremental PV of tax savings using DDB depreciation s 3,201 Incremental PV of tax savings using DDB depreciation (292) Lou Lewis, the president of Lewisville Company, has asked you to give him an analysis of the best use of a warehouse the company owns. a. Lewisville Company is currently leasing the warehouse to another company for $5,400 per month on a year-to-year basis. (Hint. Use the PV function in Excel to calculate, on an after-tax basis, the PV of this stream of monthly rental receipts.) b. The warehouse's estimated sales value is $210,000. A commercial realtor believes that the price is likely to remain unchanged in the near future. The building originally cost $62,000 and is being depreciated at $1,700 annually. Its current net book value (NBV) is $7,700. c. Lewisville Company is seriously considering converting the warehouse into a factory outlet for furniture. The remodeling will cost $120,000 and will be modest because the major attraction will be rock-bottom prices. The remodeling cost will be depreciated over the next 5 years using the double-declining-balance method. (Note: Use the VDB function in Excel to calculate depreciation charges. The advantage of using the VDB, rather than the DDB, function is that there is a (default) option in the former that provides an automatic switch to the straight-line method when it is advantageous to do so.) d. The inventory and receivables (net of current liabilities) needed to open and sustain the factory outlet would be $630,000. This total is fully recoverable whenever operations terminate. e. Lou is fairly certain that the warehouse will be condemned in 10 years to make room for a new highway. The firm most likely would receive $220,000 from the condemnation. f. Estimated annual operating data, exclusive of depreciation, are as follows: Sales (cash) Operating expenses $920,000 $520,000 g. Nonrecurring sales promotion costs at the beginning of year 1 (i.e., time 0) are expected to be $106,000. (These costs are fully deductible for tax purposes.) h. Nonrecurring termination costs at the end of year 5 are $54,000. (These costs are fully deductible for tax purposes.) i. The after-tax discount rate for capital budgeting purposes is 11%. (To calculate the present value factor for each year, i, i = 1, 5, use the following formula: PV factor ; = (1 = 1.114). The company is in the 38% tax bracket (federal and state combined). Show how you would handle the individual items in determining whether the company should continue to lease the space or convert it to a factory outlet. Use PV function in Excel, VDB function in Excel to calculate annual depreciation charges. Use NPV function to calculate depreciation tax savings. (Negative amounts should be indicated by a minus sign. Round your answers to the nearest whole dollar.) Item Description After-tax monthly rent foregone All are irrelevant $ b. S S Remodeling cost (capitalized) Depreciation tax savings (DDB method; @38%) Investment in net working capital Recovery of net working capital Cash Flows in Year PV 0 1 2 3 4 5 (153,985) $ 0 $ 40,176 $ 40,176 $ 40,176 $ 40,176 $ 40,176 0S 0S 0S 0S 0S 0S 0 (120,000) 14120.000, $ 0S 0S 0S 0S 0% 36,283 S 0 $ 18,240 $ 10,944 $ 6,566 $ 4,925 $ 4,925 (630,000) 620 000S 0S 0S 0S 0S 0 373,874 $ 0 0S 0S 0S 0S 630,000 2,108,140S 0 S 570,400 $ 570,400 $ 570,400 $ 570,400 $ 570,400 (1,191,557) $ 00$ (322,400) 1322.400 $(322,400) 1322.400) 322.400) (65,720) $ (65,720) $ 0S 0S 0S 0S 0 19,869 $ 0 $ 00S 00S 0S 0S 33,480 376,904 f After-tax cash sales $ $ $ $ After-tax cash operating expenses After-tax sales promotion cost, year 0 After-tax termination cost, year 5 NPV = $ Freedom Corporation acquired a fixed asset for $220,000. Its estimated life at time of purchase was 4 years, with no estimated salvage value. Assume a discount rate of 7% and an income tax rate of 40%. (Use Exhibit 12.4, Appendix C, TABLE 1 and Appendix C, TABLE 2.) TABLE2 Present Value of Annuity of $1 Periods 4% 5% 6% 7% 8% 9% 10% 11% 12% 13% 14% 15% 20% 25% 30% 1 0.962 0.952 0.943 0.935 0.926 0.917 0.909 0.901 0.893 0.585 0.377 0.870 0.333 0.800 0.769 1.556 1.559 1.533 1.308 1.783 1.759 1.736 1.713 1.690 1.665 1.647 1.626 1.528 1.440 1.361 3 2.775 2.723 2.673 2.624 2.577 2.531 2.487 2.444 2.402 2.361 2.322 2.283 2.106 1.952 1.516 4 3.630 3.546 3.465 3.357 3.312 3.240 3.170 3.102 3.037 2.974 2.914 2.355 2.539 2.362 2.166 5 4.452 4.329 4.212 4.100 3.993 3.390 3.791 3.696 3.605 3.517 3.433 3.352 2.991 2.659 2.436 6 5.242 5.076 4.917 4.767 4.623 4.456 4.355 4.231 4.111 3.999 3.889 3.784 3.326 2.951 2.643 7 6.002 5.756 5.582 5.389 5.206 5.033 4.568 4.712 4.564 4.423 4.288 4.160 3.605 3.161 2.502 8 6.733 6.463 6.210 5.971 5.747 5.535 5.335 5.146 4.96S 4.799 4.639 4.437 3.837 3.329 2.925 9 7.435 7.108 6.802 6.515 6.247 5.995 5.759 5.537 5.328 5.132 4.946 4.772 4.031 3.463 3.019 10 3.111 7.722 7.360 7.024 6.710 6.418 6.145 5.889 5.650 5.426 5.216 5.019 4.192 3.571 3.092 11 3 .760 8.306 7.887 7.499 7.139 6.305 6.495 6.207 5.939 5.687 5.453 5.234 4.327 3.656 3.147 12 9.355 8.563 3.354 7.943 7.536 7.161 6.814 6.492 6.194 5.915 5.660 5.421 4.439 3.725 3.190 13 9.986 9.394 8.553 .358 7.904 7.487 7.103 6.750 6.424 6.122 5.342 5.583 4.533 3.750 3.223 14 10.563 9.399 9.295 3.745 8.244 7.786 7.367 6.982 6.628 6.302 6.002 5.724 4.611 3.824 3.249 15 11.115 10.350 9.712 9.108 3.559 8.061 7.606 7.191 6.511 6.462 6.142 5.347 4.675 3.859 3.268 16 11.652 10.538 10.106 9.447 3.851 .313 7.824 7.379 6.974 6.604 6.265 5.954 4.730 3.857 3.283 17 12.166 11.274 10.477 9.763 9.122 8.544 3.022 7.549 7.120 6.729 6.373 6.047 4.775 3.910 3.295 18 12.659 11.690 10.328 10.059 9.372 8.756 3.201 7.702 7.250 6.540 6.467 6.125 4.812 3.928 3.304 19 1 3.134 12.055 11.158 10.336 9.604 3.950 .365 7.539 7.366 6.938 6.550 6.198 4.543 3.942 3.311 20 13.590 12.462 11.470 10.594 9.818 9.129 8.514 7.963 7.469 7.025 6.623 6.259 4.570 3.954 3.316 14.451 13.163 12.042 11.061 10.201 9.442 3.772 .176 7.645 7.170 6.743 6.359 4.909 3.970 3.323 24 15.247 13.799 12.550 11.469 10.529 9.707 8.985 .343 7.784 7.283 6.835 6.434 4.937 3.981 3.327 15.622 14.094 12.783 11.654 10.675 9.3239.077 3.422 7.543 7.330 6.373 6.464 4.948 3.985 3.329 30 17.292 15.372 13.765 12.409 11.258 10.274 9.427 5.694 5.055 7.496 7.003 6.566 4.979 3.995 3.332 35 15.665 16.374 14.498 12.948 11.655 10.567 9.644 3.355 3.176 7.586 7.070 6.617 4.992 3.999 3.333 40 19.793 17.159 15.046 13.332 11.925 10.757 9.779 5.951 8.244 7.634 7.105 6.642 4.997 3.999 3.333 Note: The present value (PV) annuity factor for N periods and a rate of r per period = [1 - (1 + r)-V) = r. For example, for N = 5 and r=0.10, the PV annuity factor = 3.791 (rounded). TABLE 1 Present Value of $1 Periods 4% 5% 6% 7% 8% 9% 10% 11% 12% 13% 14% 15% 20% 25% 30% 1 0.962 0.952 0.943 0.935 0.926 0.917 0.909 0.901 0.893 0.585 0.877 0.870 0.833 0.500 0.769 2 0.925 0.907 0.590 0.373 0.557 0.542 0.826 0.812 0.797 0.783 0.769 0.756 0.694 0.640 0.592 3 0.889 0.864 0.540 0.816 0.794 0.772 0.751 0.731 0.712 0.693 0.675 0.655 0.579 0.512 0.455 4 0.355 0.823 0.792 0.763 0.735 0.708 0.683 0.659 0.636 0.613 0.592 0.572 0.482 0.410 0.350 5 0.522 0.784 0.747 0.713 0.681 0.650 0.621 0.593 0.567 0.543 0.519 0.497 0.402 0.328 0.269 6 0.790 0.746 0.705 0.666 0.630 0.596 0.564 0.535 0.507 0.480 0.456 0.432 0.335 0.262 0.207 7 0.760 0.711 0.665 0.623 0.583 0.547 0.513 0.482 0.452 0.425 0.400 0.376 0.279 0.210 0.159 S 0.731 0.677 0.627 0.582 0.540 0.502 0.467 0.434 0.404 0.376 0.351 0.327 0.233 0.163 0.123 9 0.703 0.645 0.592 0.544 0.500 0.460 0.424 0.391 0.361 0.333 0.308 0.284 0.194 0.134 0.094 10 0.676 0.614 0.558 0.508 0.463 0.422 0.356 0.352 0.322 0.295 0.270 0.247 0.162 0.107 0.073 0.650 0.585 0.527 0.475 0.429 0.383 0.350 0.317 0.287 0.261 0.237 0.215 0.135 0.036 0.056 0.625 0.557 0.497 0.444 0.397 0.356 0.319 0.286 0.257 0.231 0.208 0.187 0.112 0.069 0.043 13 0.601 0.530 0.469 0.415 0.368 0.326 0.290 0.25% 0.229 0.204 0.182 0.163 0.093 0.055 0.033 0.577 0.505 0.442 0.388 0.340 0.299 0.263 0.232 0.205 0.181 0.160 0.141 0.078 0.044 0.025 15 0.555 0.481 0.417 0.362 0.315 0.275 0.239 0.209 0.183 0.160 0.140 0.123 0.065 0.035 0.020 16 0.534 0.458 0.394 0.339 0.292 0.252 0.218 0.18 0.163 0.141 0.123 0.107 0.054 0.028 0.015 0.513 0.436 0.371 0.317 0.270 0.231 0.198 0.170 0.146 0.125 0.105 0.093 0.045 0.023 0.012 18 0.494 0.416 0.350 0.296 0.250 0.212 0.150 0.153 0.130 0.111 0.095 0.081 0.035 0.018 0.009 190.475 0.396 0.331 0.277 0.232 0.194 0.164 0.138 0.116 0.098 0.083 0.070 0.031 0.014 0.007 20 0.456 0.377 0.312 0.25% 0.215 0.178 0.149 0.124 0.104 0.087 0.073 0.061 0.026 0.012 0.005 22 0.422 0.342 0.278 0.226 0.184 0.150 0.123 0.101 0.053 0.068 0.056 0.046 0.018 0.007 0.003 24 0.390 0.310 0.247 0.197 0.158 0.126 0.102 0.082 0.066 0.053 0.043 0.035 0.013 0.005 0.002 25 0.375 0.295 0.233 0.134 0.146 0.116 0.092 0.074 0.059 0.047 0.035 0.030 0.010 0.004 0.001 30 0.308 0.231 0.174 0.131 0.099 0.075 0.057 0.044 0.033 0.026 0.020 0.015 0.004 0.001 0.000 0.253 0.151 0.130 0.094 0.068 0.049 0.036 0.026 0.019 0.014 0.010 0.008 0.002 0.000 0.000 40 0.205 0.142 0.097 0.067 0.046 0.032 0.022 0.015 0.011 0.005 0.005 0.004 0.001 0.000 0.000 Note: The present value (PV) factor for N periods and rate per period = 1 = (1 + r) For example, the PV factor for 10%, 5 years = 1 = (1 + 0.10% = 0.621 (rounded) EXHIBIT 12.4 MACRS Depreciation Rates Year 3-year 5-year 7-year 10-year 15-year 20-year 1 33.33 20.00 14.29 10.00 5.00 3.75 2 44.45 32.00 24.49 18.00 9.50 7.22 3 14.81 19.20 17.49 14.40 8.55 6.68 4 7.41 11.52* 12.49 11.52 7.70 6.18 11.52 8.93* 9.22 6.93 5.71 5.76 8.92 7.37 6.23 5.28 8.92 6.55* 5.90* 4.89 4.47 6.55 5.90 4.52 6.56 5.91 4.46% 6.55 5.90 4.46 3.28 etc. etc. Required 1 Required 2 Required 3 What is the incremental present value of the tax benefits resulting from calculating depreciation using the double-declining- balance (DDB) method rather than the straight-line (SLN) method on this asset? Use the SLN and DDB functions in Excel to calculate depreciation charges. (Negative amount should be indicated by a minus sign. Round your answer to the nearest whole dollar.) Show less Incremental PV of tax savings using DDB depreciation 996 X Incremental PV of tax savings using DDB depreciation s (996) Incremental PV of tax savings using DDB depreciation s 3,201 Incremental PV of tax savings using DDB depreciation (292)Step by Step Solution
There are 3 Steps involved in it
Step: 1

Get Instant Access to Expert-Tailored Solutions
See step-by-step solutions with expert insights and AI powered tools for academic success
Step: 2

Step: 3
Ace Your Homework with AI
Get the answers you need in no time with our AI-driven, step-by-step assistance
Get Started
The Law And Economics Of Patent Damages, Antitrust, And Legal Process
Authors: James Langenfeld, Frank Fagan, Samuel Clark
2nd Edition
1800710259, 9781800710252