question 1: In the column labeled "to" (column D), fill in the numbers of the appropriate nodes based on your review of the network diagram. the cost information in the model should be helpful in filling out this column. Describe what to "To" nodes represent in the model.
question 2: In the column labeled "supply/demand" (column 1), fill in the appropriate supply (should be typed as a negative number) or demand (should be typed in as a positive number) for the respective node. for exemple l, cell I6 would be the supply or demand at node 1. Describe in detail the interpretation of the value in Cell I10.
question 3: There are two constraints in this problem: first is the relationship between the Net Flow and Supply/Demand. Describe this relationship and then incorporate the constraint in Excel.
question 4: The second constraint is the relationship between the flow (decision variables) and the minimum number of units that must be moved from each node. Describe this relationship and then incorporate the constraint in Excel.
question 5: The formula for the Objective Function in cell E16 is missing, Enter the appropriate formula and describe what is being calculated in that cell. Once you have entered the formula and the two constraints from question 3 and 4 above, solve the model. What is the optimal solution?
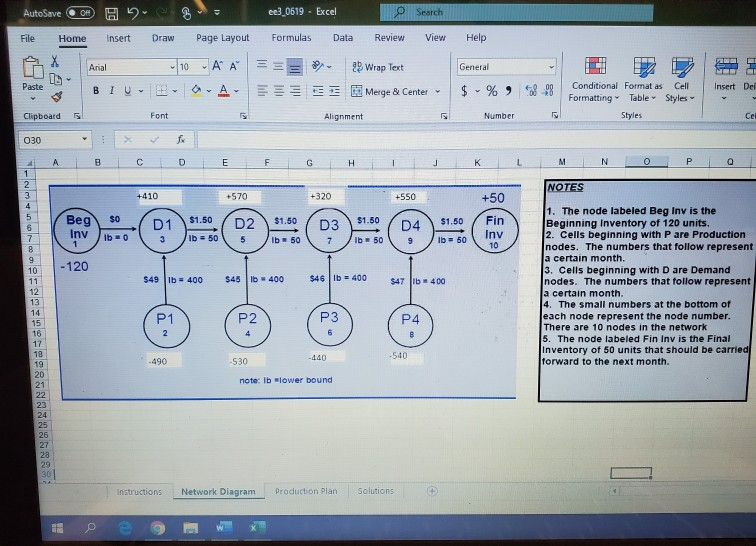
first picture is the network diagram
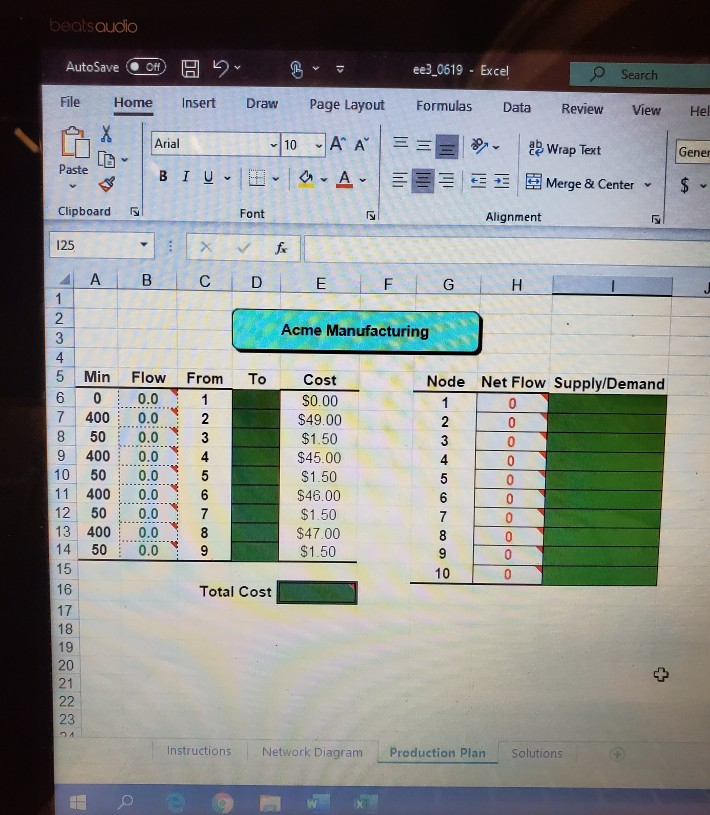
production plan picture, use Solver to solve it
ee3_0619 - Excel Search AutoSave ff Formulas Review View Help File Insert Draw Page Layout Data Home A A" 10 29 Wrap Text Arial General $ - % 9 8 98 Conditional Format as Cell Insert Del Paste BIU 2= E Merge & Center Formatting Table Styles Styles Clipboard Font Alignment Number Cel fe 030 NOTES +320 +410 +570 +550 +50 1. The node labeled Beg Inv is the Beginning Inventory of 120 units. 2. Cells beginning with P are Production nodes. The numbers that follow represent la certain month. 3. Cells beginning with D are Demand nodes. The numbers that follow represent a certain month. 4. The small numbers at the bottom of each node represent the node number. There are 10 nodes in the network 5. The node labeled Fin Inv is the Final Inventory of 50 units that should be carried forward to the next month. Beg Inv 5. $0 $1.50 Fin D1 Ib = 50 $1.50 $1.50 D2 $1.50 D3 D4 Inv Ib= 0 /Ib 50 Ib 50 Ib= 50 10 -120 10 Ib = 400 $49 ib 400 $45 Ib 400 $46 $47 ib 400 11 12 13 14 P3 P1 P2 P4 15 16 17 18 -540 -440 490 -530 19 20 21 note: Ib lower bound 22 23 24 25 26 27 28 29 30 Network Diagram Solutions Instructions Production Plan ) -234 in67 beatsaudio AutoSave ee3_0619 - Excel Off P Search File Home Insert Draw Page Layout Formulas Data Review View Hel - 10 - A A Arial 2 Wrap Text Gener Paste BIU E -A E EE E E Merge & Center Clipboard Font Alignment 125 fx A G Acme Manufacturing 4 5 Min Flow From To Cost Node Net Flow Supply/Demand 0 0.0 0.0 0.0 $0.00 7 400 $49.00 50 $1.50 400 0.0 4 $45.00 4 10 50 11 400 0.0 $1.50 0.0 $46.00 12 50 0.0 $1.50 13 400 0.0 $47.00 $1.50 0.0 14 50 15 10 16 Total Cost 17 18 19 20 21 22 23 Instructions Network Diagram Production Plan Solutions ........ ee3_0619 - Excel Search AutoSave ff Formulas Review View Help File Insert Draw Page Layout Data Home A A" 10 29 Wrap Text Arial General $ - % 9 8 98 Conditional Format as Cell Insert Del Paste BIU 2= E Merge & Center Formatting Table Styles Styles Clipboard Font Alignment Number Cel fe 030 NOTES +320 +410 +570 +550 +50 1. The node labeled Beg Inv is the Beginning Inventory of 120 units. 2. Cells beginning with P are Production nodes. The numbers that follow represent la certain month. 3. Cells beginning with D are Demand nodes. The numbers that follow represent a certain month. 4. The small numbers at the bottom of each node represent the node number. There are 10 nodes in the network 5. The node labeled Fin Inv is the Final Inventory of 50 units that should be carried forward to the next month. Beg Inv 5. $0 $1.50 Fin D1 Ib = 50 $1.50 $1.50 D2 $1.50 D3 D4 Inv Ib= 0 /Ib 50 Ib 50 Ib= 50 10 -120 10 Ib = 400 $49 ib 400 $45 Ib 400 $46 $47 ib 400 11 12 13 14 P3 P1 P2 P4 15 16 17 18 -540 -440 490 -530 19 20 21 note: Ib lower bound 22 23 24 25 26 27 28 29 30 Network Diagram Solutions Instructions Production Plan ) -234 in67 beatsaudio AutoSave ee3_0619 - Excel Off P Search File Home Insert Draw Page Layout Formulas Data Review View Hel - 10 - A A Arial 2 Wrap Text Gener Paste BIU E -A E EE E E Merge & Center Clipboard Font Alignment 125 fx A G Acme Manufacturing 4 5 Min Flow From To Cost Node Net Flow Supply/Demand 0 0.0 0.0 0.0 $0.00 7 400 $49.00 50 $1.50 400 0.0 4 $45.00 4 10 50 11 400 0.0 $1.50 0.0 $46.00 12 50 0.0 $1.50 13 400 0.0 $47.00 $1.50 0.0 14 50 15 10 16 Total Cost 17 18 19 20 21 22 23 Instructions Network Diagram Production Plan Solutions