

Answered step by step
Verified Expert Solution
Question
1 Approved Answer
Question 1 is already answerd. please assist on Q2 2. Based on the information provided above, An Analyst compiled the following information of that firm,
Question 1 is already answerd. please assist on Q2 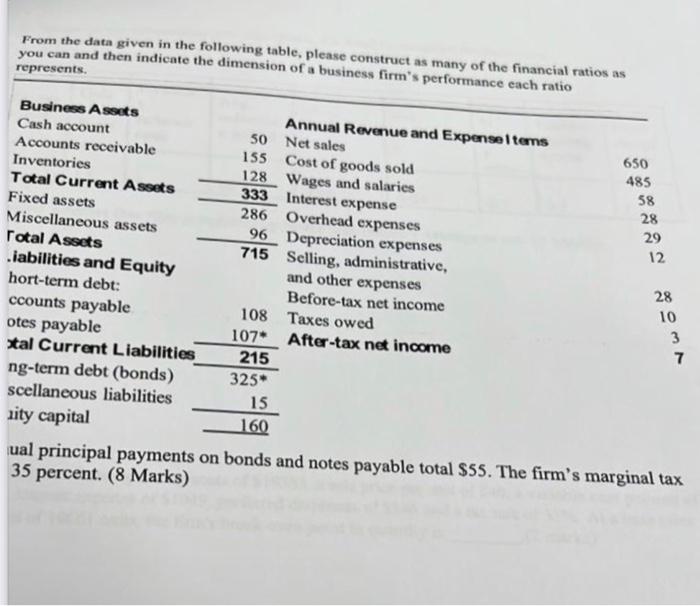
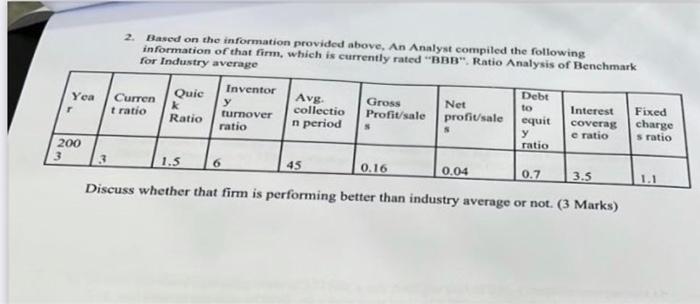
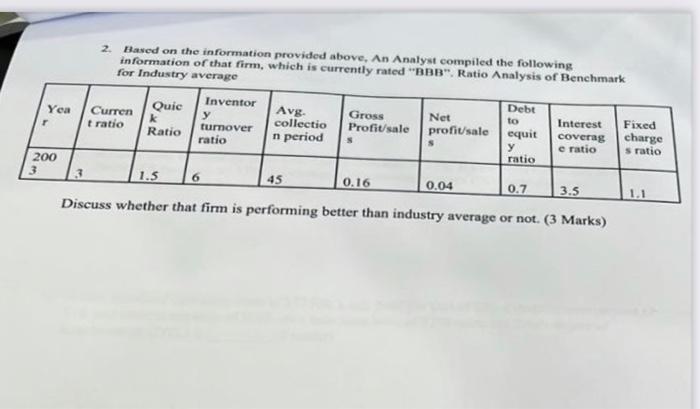
2. Based on the information provided above, An Analyst compiled the following information of that firm, which is currently rated "BBB". Ratio Analysis of Benchmark for Industry average Yea Curren Quic k Debt to Interest Inventor y turnover ratio Avg. collectio n period Gross Profit/sale S Net profit/sale r t ratio Fixed charge Ratio equit y coverag e ratio S s ratio ratio 200 3 1.5 6 45 0.16 0.04 0.7 3.5 1.1 Discuss whether that firm is performing better than industry average or not. (3 Marks) From the data given in the following table, please construct as many of the financial ratios as you can and then indicate the dimension of a business firm's performance each ratio represents. Business Assets Annual Revenue and ExpenselItems Net sales Cash account 50 650 Accounts receivable 155 Cost of goods sold 485 Inventories 128 Wages and salaries Total Current Assets 333 Interest expense Fixed assets 286 Overhead expenses Miscellaneous assets 96 Depreciation expenses Total Assets 715 .iabilities and Equity Selling, administrative, and other expenses hort-term debt: Before-tax net income ccounts payable 108 Taxes owed otes payable 107* After-tax net income 7 tal Current Liabilities 215 ng-term debt (bonds) 325* scellaneous liabilities 15 ity capital 160 ual principal payments on bonds and notes payable total $55. The firm's marginal tax 35 percent. (8 Marks) 58 28 29 12 28 10 3 2. Based on the information provided above, An Analyst compiled the following information of that firm, which is currently rated "BBB". Ratio Analysis of Benchmark for Industry average Debt Curren Quic k to Interest Fixed Inventor y turnover ratio Avg. collectio n period Gross Profit/sale S Net profit/sale t ratio coverag Ratio equit y charge s ratio S e ratio ratio 3 3 1.5 6 45 0.16 0.04 0.7 3.5 1.1 Discuss whether that firm is performing better than industry average or not. (3 Marks) Yea r 200 2. Based on the information provided above, An Analyst compiled the following information of that firm, which is currently rated "BBB". Ratio Analysis of Benchmark for Industry average Yea Curren Quic k Debt to Interest Inventor y turnover ratio Avg. collectio n period Gross Profit/sale S Net profit/sale r t ratio Fixed charge Ratio equit y coverag e ratio S s ratio ratio 200 3 1.5 6 45 0.16 0.04 0.7 3.5 1.1 Discuss whether that firm is performing better than industry average or not. (3 Marks) From the data given in the following table, please construct as many of the financial ratios as you can and then indicate the dimension of a business firm's performance each ratio represents. Business Assets Annual Revenue and ExpenselItems Net sales Cash account 50 650 Accounts receivable 155 Cost of goods sold 485 Inventories 128 Wages and salaries Total Current Assets 333 Interest expense Fixed assets 286 Overhead expenses Miscellaneous assets 96 Depreciation expenses Total Assets 715 .iabilities and Equity Selling, administrative, and other expenses hort-term debt: Before-tax net income ccounts payable 108 Taxes owed otes payable 107* After-tax net income 7 tal Current Liabilities 215 ng-term debt (bonds) 325* scellaneous liabilities 15 ity capital 160 ual principal payments on bonds and notes payable total $55. The firm's marginal tax 35 percent. (8 Marks) 58 28 29 12 28 10 3 2. Based on the information provided above, An Analyst compiled the following information of that firm, which is currently rated "BBB". Ratio Analysis of Benchmark for Industry average Debt Curren Quic k to Interest Fixed Inventor y turnover ratio Avg. collectio n period Gross Profit/sale S Net profit/sale t ratio coverag Ratio equit y charge s ratio S e ratio ratio 3 3 1.5 6 45 0.16 0.04 0.7 3.5 1.1 Discuss whether that firm is performing better than industry average or not. (3 Marks) Yea r 200 Step by Step Solution
There are 3 Steps involved in it
Step: 1

Get Instant Access to Expert-Tailored Solutions
See step-by-step solutions with expert insights and AI powered tools for academic success
Step: 2

Step: 3
Ace Your Homework with AI
Get the answers you need in no time with our AI-driven, step-by-step assistance
Get Started
School Finance Elections
Authors: Don E. Lifto, Bradford J. Senden, Daniel A. Domenech
2nd Edition
1607091488, 978-1607091486