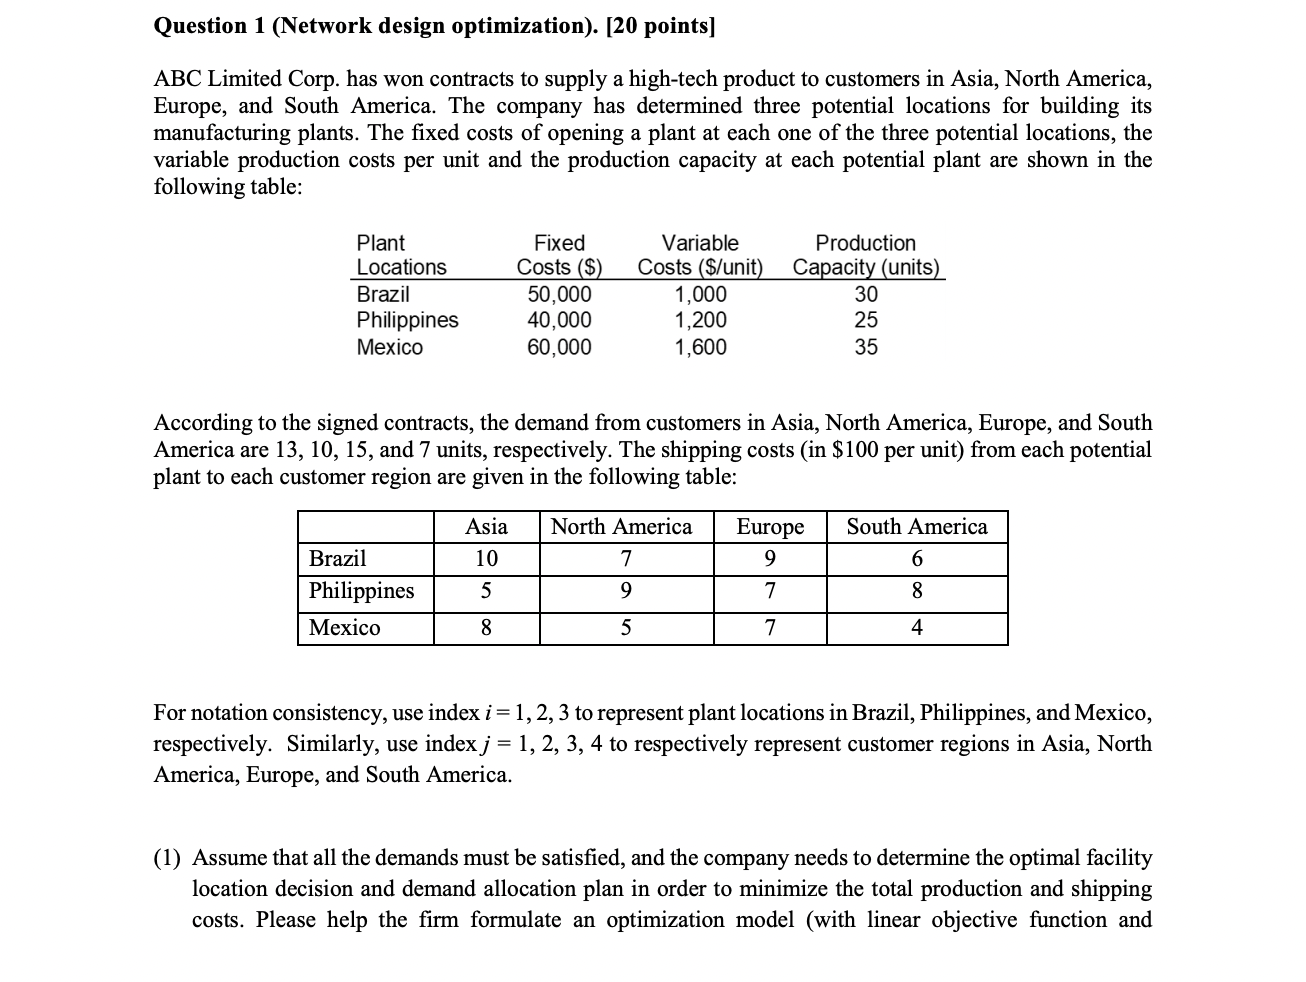
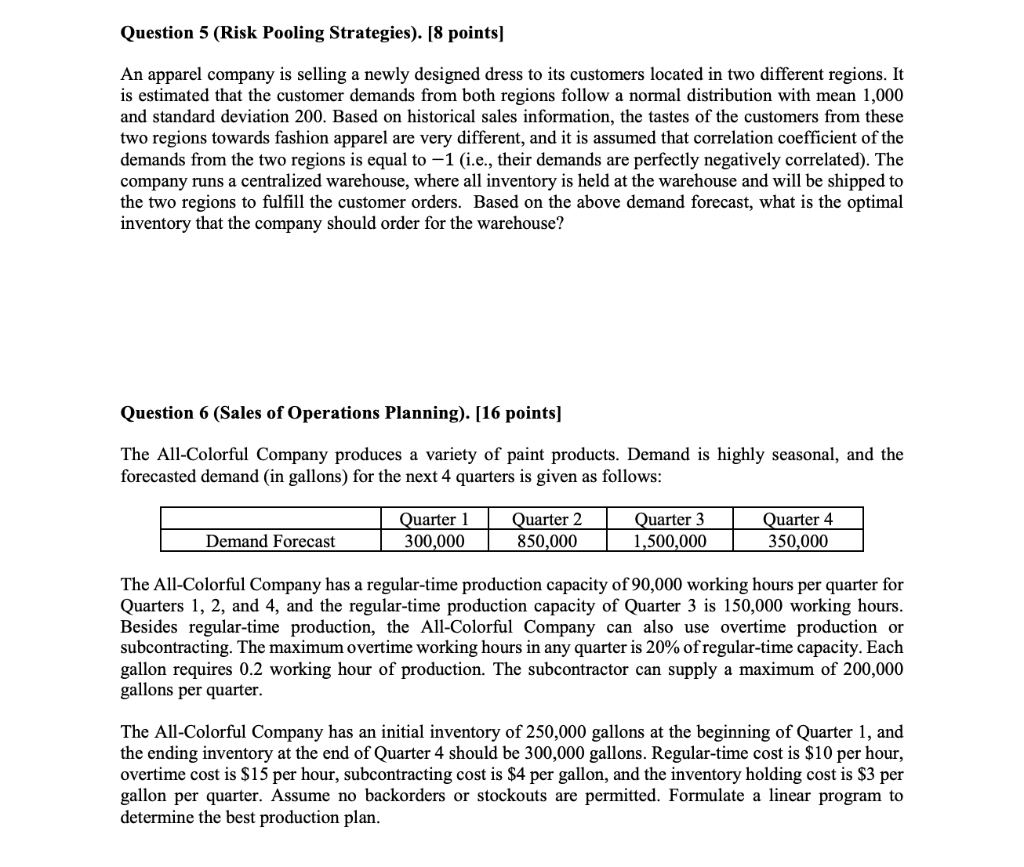
Question 1 (Network design optimization). [20 points] ABC Limited Corp. has won contracts to supply a high-tech product to customers in Asia, North America, Europe, and South America. The company has determined three potential locations for building its manufacturing plants. The fixed costs of opening a plant at each one of the three potential locations, the variable production costs per unit and the production capacity at each potential plant are shown in the following table: Plant Locations Brazil Philippines Mexico Fixed Costs ($) 50,000 40,000 60,000 Variable Costs ($/unit) 1,000 1,200 1,600 Production Capacity (units) 30 25 35 According to the signed contracts, the demand from customers in Asia, North America, Europe, and South America are 13, 10, 15, and 7 units, respectively. The shipping costs (in $100 per unit) from each potential plant to each customer region are given in the following table: Asia North America Europe South America 10 7 9 6 Brazil Philippines Mexico 5 9 7 8 8 5 7 4 For notation consistency, use index i=1,2, 3 to represent plant locations in Brazil, Philippines, and Mexico, respectively. Similarly, use index j = 1, 2, 3, 4 to respectively represent customer regions in Asia, North America, Europe, and South America. (1) Assume that all the demands must be satisfied, and the company needs to determine the optimal facility location decision and demand allocation plan in order to minimize the total production and shipping costs. Please help the firm formulate an optimization model (with linear objective function and constraints) to achieve the minimum total costs. For simplicity, assume that the shipping quantities from a plant to a demand region does not necessarily have to be an integer. In your model, you can either use the concrete numbers (e.g., use 50,000 in your model for fixed cost of the plant in Brazil), or alternatively, you can clearly define a variable to represent each parameter (e.g., define fi as the fixed cost of plant in site i) and use them in your model. (2) Suppose due to regulation and operational issues, ABC Limited Corp has some additional constraints as specified below. Please capture these additional requirements by formulating linear constraints, which can be then added to the basic model in part (1). (A) The company can open at most two plants. (B) If the plant in Brazil is opened, then the Philippines plant should also be opened. (C) The Philippines plant can be opened only if both Brazil and Mexico plants are opened. (D) If either one of Brazil or the Mexico plants is open, then the Philippines plant should also be opened. Question 2 (Network design optimization). [18 points] Refer to the complete SunOil Model (with decision variables Xij, Yil, and yin) in Lecture 5 Slide (full version) slide 14. Now suppose we have an additional single sourcing requirement. That is, each consumer market can only be served by a single plant site. For example, if we decide that the European market demand will be fulfilled by the plant in Asia, then all the 14 million units demand in Europe must all come from the Asian plant and Europe cannot receive shipments from any other plant. Revise the SunOil model we discussed in class to reflect the above single sourcing constraint. Please make sure your model has linear objective function and linear constraints. Feel free to define new decision variables however you see fit. For notation consistency, use index i, j=1, 2, 3, 4, 5 to respectively represent supply sites (i) and demand regions (i) in N. America, S. America, Europe, Asia, and Africa. Question 3 (Inventory Management I). [20 points) Rainbow Colors paint store uses a continuous review inventory system to control its stock levels. For a popular eggshell latex paint, historical data show that the distribution of monthly demand is approximately Normal, with mean 28 and standard deviation 8. Replenishment lead time for this paint is 2 months. Each can of paint costs the store $6. Fixed cost of replenishment is $15 per order and holding costs are based on a 30% annual interest rate. (1) What is the optimal lot size (economic order quantity) Q*? (2) What is the optimal reorder point (ROP) if Rainbow Colors wants to achieve a 90% cycle service level (i.e., Type I service level)? (3) Suppose the firm adopts a continuous review policy that uses the optimal Q* and ROP computed in (1) and (2). What is the Type II service level that corresponds to this policy? (4) Suppose the firm orders in the batch size of Q* computed in (1). What is the optimal reorder point (ROP) if Rainbow Colors wants to ensure that 90% of the demand are satisfied on time (i.e., Type II service level)? Question 4(Inventory Management II). [18 points] You are the store manager at a large furniture store. One of your products is a study desk. Weekly demand for the desk is normally dist with mean 40 and standa deviation 20, and demands across erent periods are independent from each other. The lead time from the assembly plant to your store is two weeks. Suppose you use the order-up-to model to manage inventory, and inventory is reviewed every week. (A) Suppose your order-up-to level is S = 220. You are about to place an order and note that your current on-hand inventory level is 100 and you have 85 desks still in transit (i.e., in pipeline). How many desks will you order? (B) What is the optimal order-up-to level (rounded to the nearest integer) if you want to target a 98% cycle service level? (C) Now suppose you decide to adopt a continuous review policy to manage inventory, and the reorder point (ROP) is set to be 80. The demand and lead time information remain unchanged. What is the average number of lost sales in a replenishment cycle? Question 5 (Risk Pooling Strategies). [8 points) An apparel company is selling a newly designed dress to its customers located in two different regions. It is estimated that the customer demands from both regions follow a normal distribution with mean 1,000 and standard deviation 200. Based on historical sales information, the tastes of the customers from these two regions towards fashion apparel are very different, and it is assumed that correlation coefficient of the demands from the two regions is equal to -1 (i.e., their demands are perfectly negatively correlated). The company runs a centralized warehouse, where all inventory is held at the warehouse and will be shipped to the two regions to fulfill the customer orders. Based on the above demand forecast, what is the optimal inventory that the company should order for the warehouse? Question 6 (Sales of Operations Planning). [16 points) The All-Colorful Company produces a variety of paint products. Demand is highly seasonal, and the forecasted demand in gallons) for the next 4 quarters is given as follows: Quarter 1 300,000 Quarter 2 850,000 Demand Forecast Quarter 3 1,500,000 Quarter 4 350,000 The All-Colorful Company has a regular-time production capacity of 90,000 working hours per quarter for Quarters 1, 2, and 4, and the regular-time production capacity of Quarter 3 is 150,000 working hours. Besides regular-time production, the All-Colorful Company can also use overtime production or subcontracting. The maximum overtime working hours in any quarter is 20% of regular-time capacity. Each gallon requires 0.2 working hour of production. The subcontractor can supply a maximum of 200,000 gallons per quarter. The All-Colorful Company has an initial inventory of 250,000 gallons at the beginning of Quarter 1, and the ending inventory at the end of Quarter 4 should be 300,000 gallons. Regular-time cost is $10 per hour, overtime cost is $15 per hour, subcontracting cost is $4 per gallon, and the inventory holding cost is $3 per gallon per quarter. Assume no backorders or stockouts are permitted. Formulate linear program to determine the best production plan. Question 1 (Network design optimization). [20 points] ABC Limited Corp. has won contracts to supply a high-tech product to customers in Asia, North America, Europe, and South America. The company has determined three potential locations for building its manufacturing plants. The fixed costs of opening a plant at each one of the three potential locations, the variable production costs per unit and the production capacity at each potential plant are shown in the following table: Plant Locations Brazil Philippines Mexico Fixed Costs ($) 50,000 40,000 60,000 Variable Costs ($/unit) 1,000 1,200 1,600 Production Capacity (units) 30 25 35 According to the signed contracts, the demand from customers in Asia, North America, Europe, and South America are 13, 10, 15, and 7 units, respectively. The shipping costs (in $100 per unit) from each potential plant to each customer region are given in the following table: Asia North America Europe South America 10 7 9 6 Brazil Philippines Mexico 5 9 7 8 8 5 7 4 For notation consistency, use index i=1,2, 3 to represent plant locations in Brazil, Philippines, and Mexico, respectively. Similarly, use index j = 1, 2, 3, 4 to respectively represent customer regions in Asia, North America, Europe, and South America. (1) Assume that all the demands must be satisfied, and the company needs to determine the optimal facility location decision and demand allocation plan in order to minimize the total production and shipping costs. Please help the firm formulate an optimization model (with linear objective function and constraints) to achieve the minimum total costs. For simplicity, assume that the shipping quantities from a plant to a demand region does not necessarily have to be an integer. In your model, you can either use the concrete numbers (e.g., use 50,000 in your model for fixed cost of the plant in Brazil), or alternatively, you can clearly define a variable to represent each parameter (e.g., define fi as the fixed cost of plant in site i) and use them in your model. (2) Suppose due to regulation and operational issues, ABC Limited Corp has some additional constraints as specified below. Please capture these additional requirements by formulating linear constraints, which can be then added to the basic model in part (1). (A) The company can open at most two plants. (B) If the plant in Brazil is opened, then the Philippines plant should also be opened. (C) The Philippines plant can be opened only if both Brazil and Mexico plants are opened. (D) If either one of Brazil or the Mexico plants is open, then the Philippines plant should also be opened. Question 2 (Network design optimization). [18 points] Refer to the complete SunOil Model (with decision variables Xij, Yil, and yin) in Lecture 5 Slide (full version) slide 14. Now suppose we have an additional single sourcing requirement. That is, each consumer market can only be served by a single plant site. For example, if we decide that the European market demand will be fulfilled by the plant in Asia, then all the 14 million units demand in Europe must all come from the Asian plant and Europe cannot receive shipments from any other plant. Revise the SunOil model we discussed in class to reflect the above single sourcing constraint. Please make sure your model has linear objective function and linear constraints. Feel free to define new decision variables however you see fit. For notation consistency, use index i, j=1, 2, 3, 4, 5 to respectively represent supply sites (i) and demand regions (i) in N. America, S. America, Europe, Asia, and Africa. Question 3 (Inventory Management I). [20 points) Rainbow Colors paint store uses a continuous review inventory system to control its stock levels. For a popular eggshell latex paint, historical data show that the distribution of monthly demand is approximately Normal, with mean 28 and standard deviation 8. Replenishment lead time for this paint is 2 months. Each can of paint costs the store $6. Fixed cost of replenishment is $15 per order and holding costs are based on a 30% annual interest rate. (1) What is the optimal lot size (economic order quantity) Q*? (2) What is the optimal reorder point (ROP) if Rainbow Colors wants to achieve a 90% cycle service level (i.e., Type I service level)? (3) Suppose the firm adopts a continuous review policy that uses the optimal Q* and ROP computed in (1) and (2). What is the Type II service level that corresponds to this policy? (4) Suppose the firm orders in the batch size of Q* computed in (1). What is the optimal reorder point (ROP) if Rainbow Colors wants to ensure that 90% of the demand are satisfied on time (i.e., Type II service level)? Question 4(Inventory Management II). [18 points] You are the store manager at a large furniture store. One of your products is a study desk. Weekly demand for the desk is normally dist with mean 40 and standa deviation 20, and demands across erent periods are independent from each other. The lead time from the assembly plant to your store is two weeks. Suppose you use the order-up-to model to manage inventory, and inventory is reviewed every week. (A) Suppose your order-up-to level is S = 220. You are about to place an order and note that your current on-hand inventory level is 100 and you have 85 desks still in transit (i.e., in pipeline). How many desks will you order? (B) What is the optimal order-up-to level (rounded to the nearest integer) if you want to target a 98% cycle service level? (C) Now suppose you decide to adopt a continuous review policy to manage inventory, and the reorder point (ROP) is set to be 80. The demand and lead time information remain unchanged. What is the average number of lost sales in a replenishment cycle? Question 5 (Risk Pooling Strategies). [8 points) An apparel company is selling a newly designed dress to its customers located in two different regions. It is estimated that the customer demands from both regions follow a normal distribution with mean 1,000 and standard deviation 200. Based on historical sales information, the tastes of the customers from these two regions towards fashion apparel are very different, and it is assumed that correlation coefficient of the demands from the two regions is equal to -1 (i.e., their demands are perfectly negatively correlated). The company runs a centralized warehouse, where all inventory is held at the warehouse and will be shipped to the two regions to fulfill the customer orders. Based on the above demand forecast, what is the optimal inventory that the company should order for the warehouse? Question 6 (Sales of Operations Planning). [16 points) The All-Colorful Company produces a variety of paint products. Demand is highly seasonal, and the forecasted demand in gallons) for the next 4 quarters is given as follows: Quarter 1 300,000 Quarter 2 850,000 Demand Forecast Quarter 3 1,500,000 Quarter 4 350,000 The All-Colorful Company has a regular-time production capacity of 90,000 working hours per quarter for Quarters 1, 2, and 4, and the regular-time production capacity of Quarter 3 is 150,000 working hours. Besides regular-time production, the All-Colorful Company can also use overtime production or subcontracting. The maximum overtime working hours in any quarter is 20% of regular-time capacity. Each gallon requires 0.2 working hour of production. The subcontractor can supply a maximum of 200,000 gallons per quarter. The All-Colorful Company has an initial inventory of 250,000 gallons at the beginning of Quarter 1, and the ending inventory at the end of Quarter 4 should be 300,000 gallons. Regular-time cost is $10 per hour, overtime cost is $15 per hour, subcontracting cost is $4 per gallon, and the inventory holding cost is $3 per gallon per quarter. Assume no backorders or stockouts are permitted. Formulate linear program to determine the best production plan