Answered step by step
Verified Expert Solution
Question
1 Approved Answer
Question 1 Not yet answered Marked out of 1.00 'C' Flag question The following dotplot was drawn from the 'Age mum' data in 'Dataplotter', which
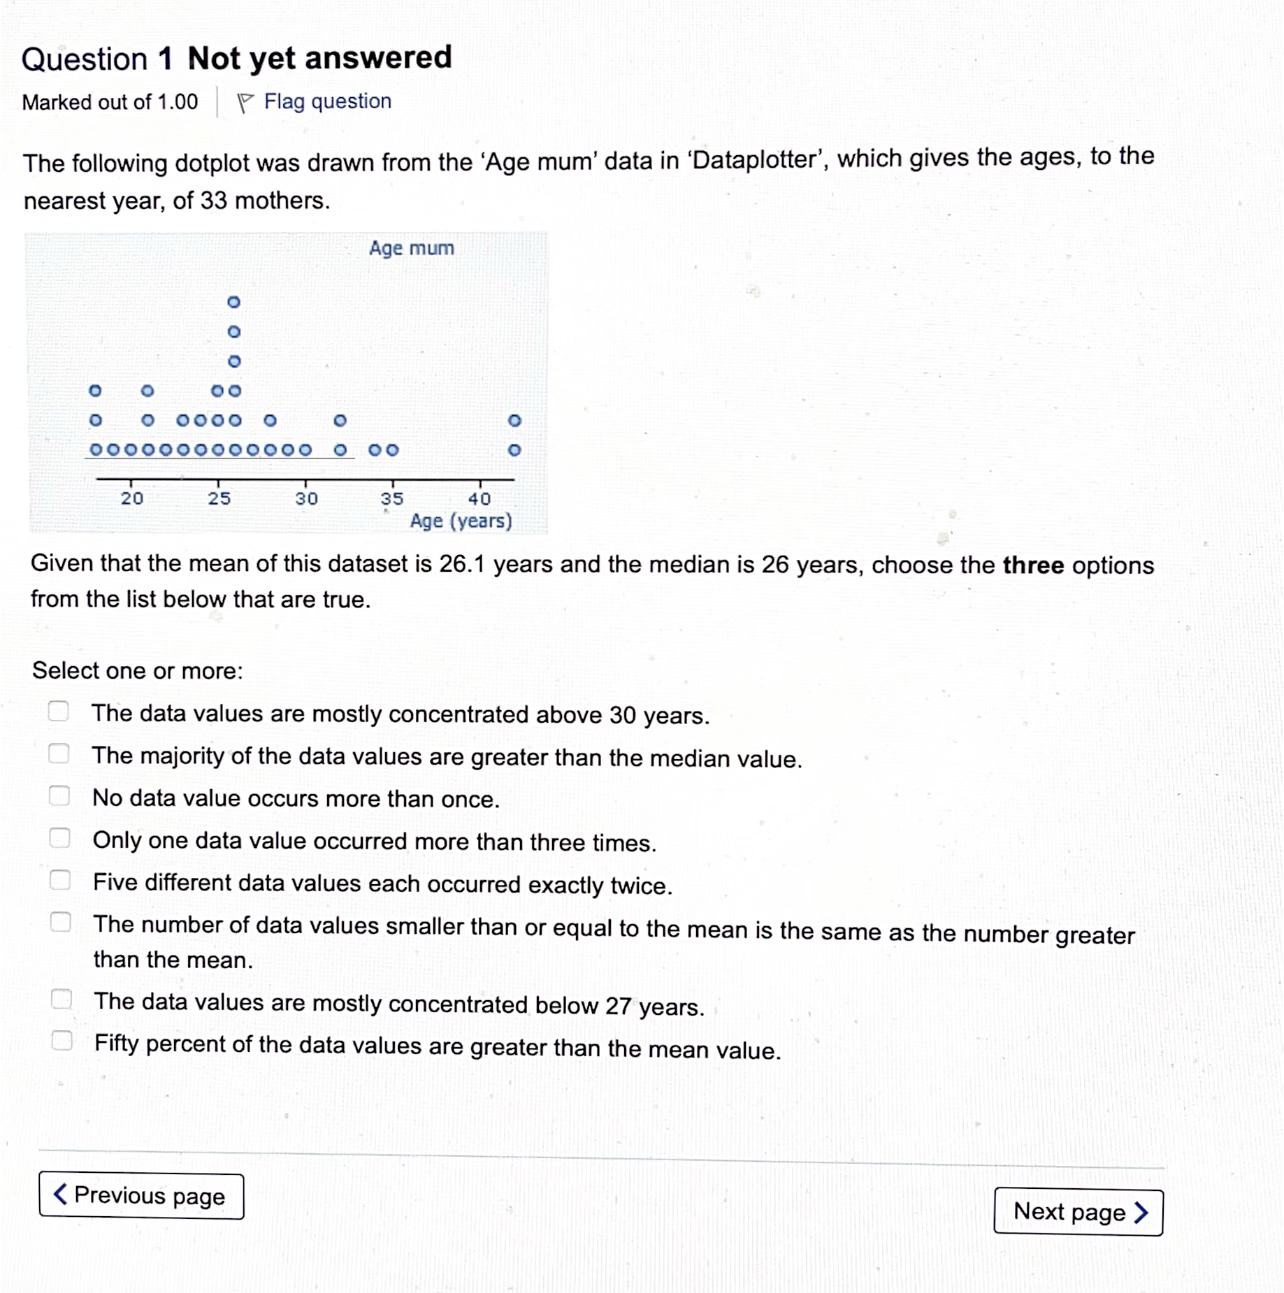
Question 1 Not yet answered Marked out of 1.00 \\'C' Flag question The following dotplot was drawn from the 'Age mum' data in 'Dataplotter', which gives the ages, to the nearest year, of 33 mothers. Agemum o o O o o oo 0 O 0000 O O O 0000000000000 0 oo o Tll_\"\"_'I'l 20 25 30 35 40 Agetyears) Given that the mean of this dataset is 26.1 years and the median is 26 years, choose the three options from the list below that are true. Select one or more: The data values are mostly concentrated above 30 years. The majority of the data values are greater than the median value. No data value occurs more than once. Only one data value occurred more than three times. Five different data values each occurred exactly twice. The number of data values smaller than or equal to the mean is the same as the number greater than the mean. The data values are mostly concentrated below 27 years. Fifty percent of the data values are greater than the mean value.
Step by Step Solution
There are 3 Steps involved in it
Step: 1
Get Instant Access to Expert-Tailored Solutions
See step-by-step solutions with expert insights and AI powered tools for academic success
Step: 2
Step: 3
Ace Your Homework with AI
Get the answers you need in no time with our AI-driven, step-by-step assistance
Get Started