

Question
Question 1: Predict future time series Having opened a new worksheet, with the use of a time series use sum of sales with order date
Question 1: Predict future time series
Having opened a new worksheet, with the use of a time series use sum of sales with order date. Use the continuous lines visualization and answer the following questions:
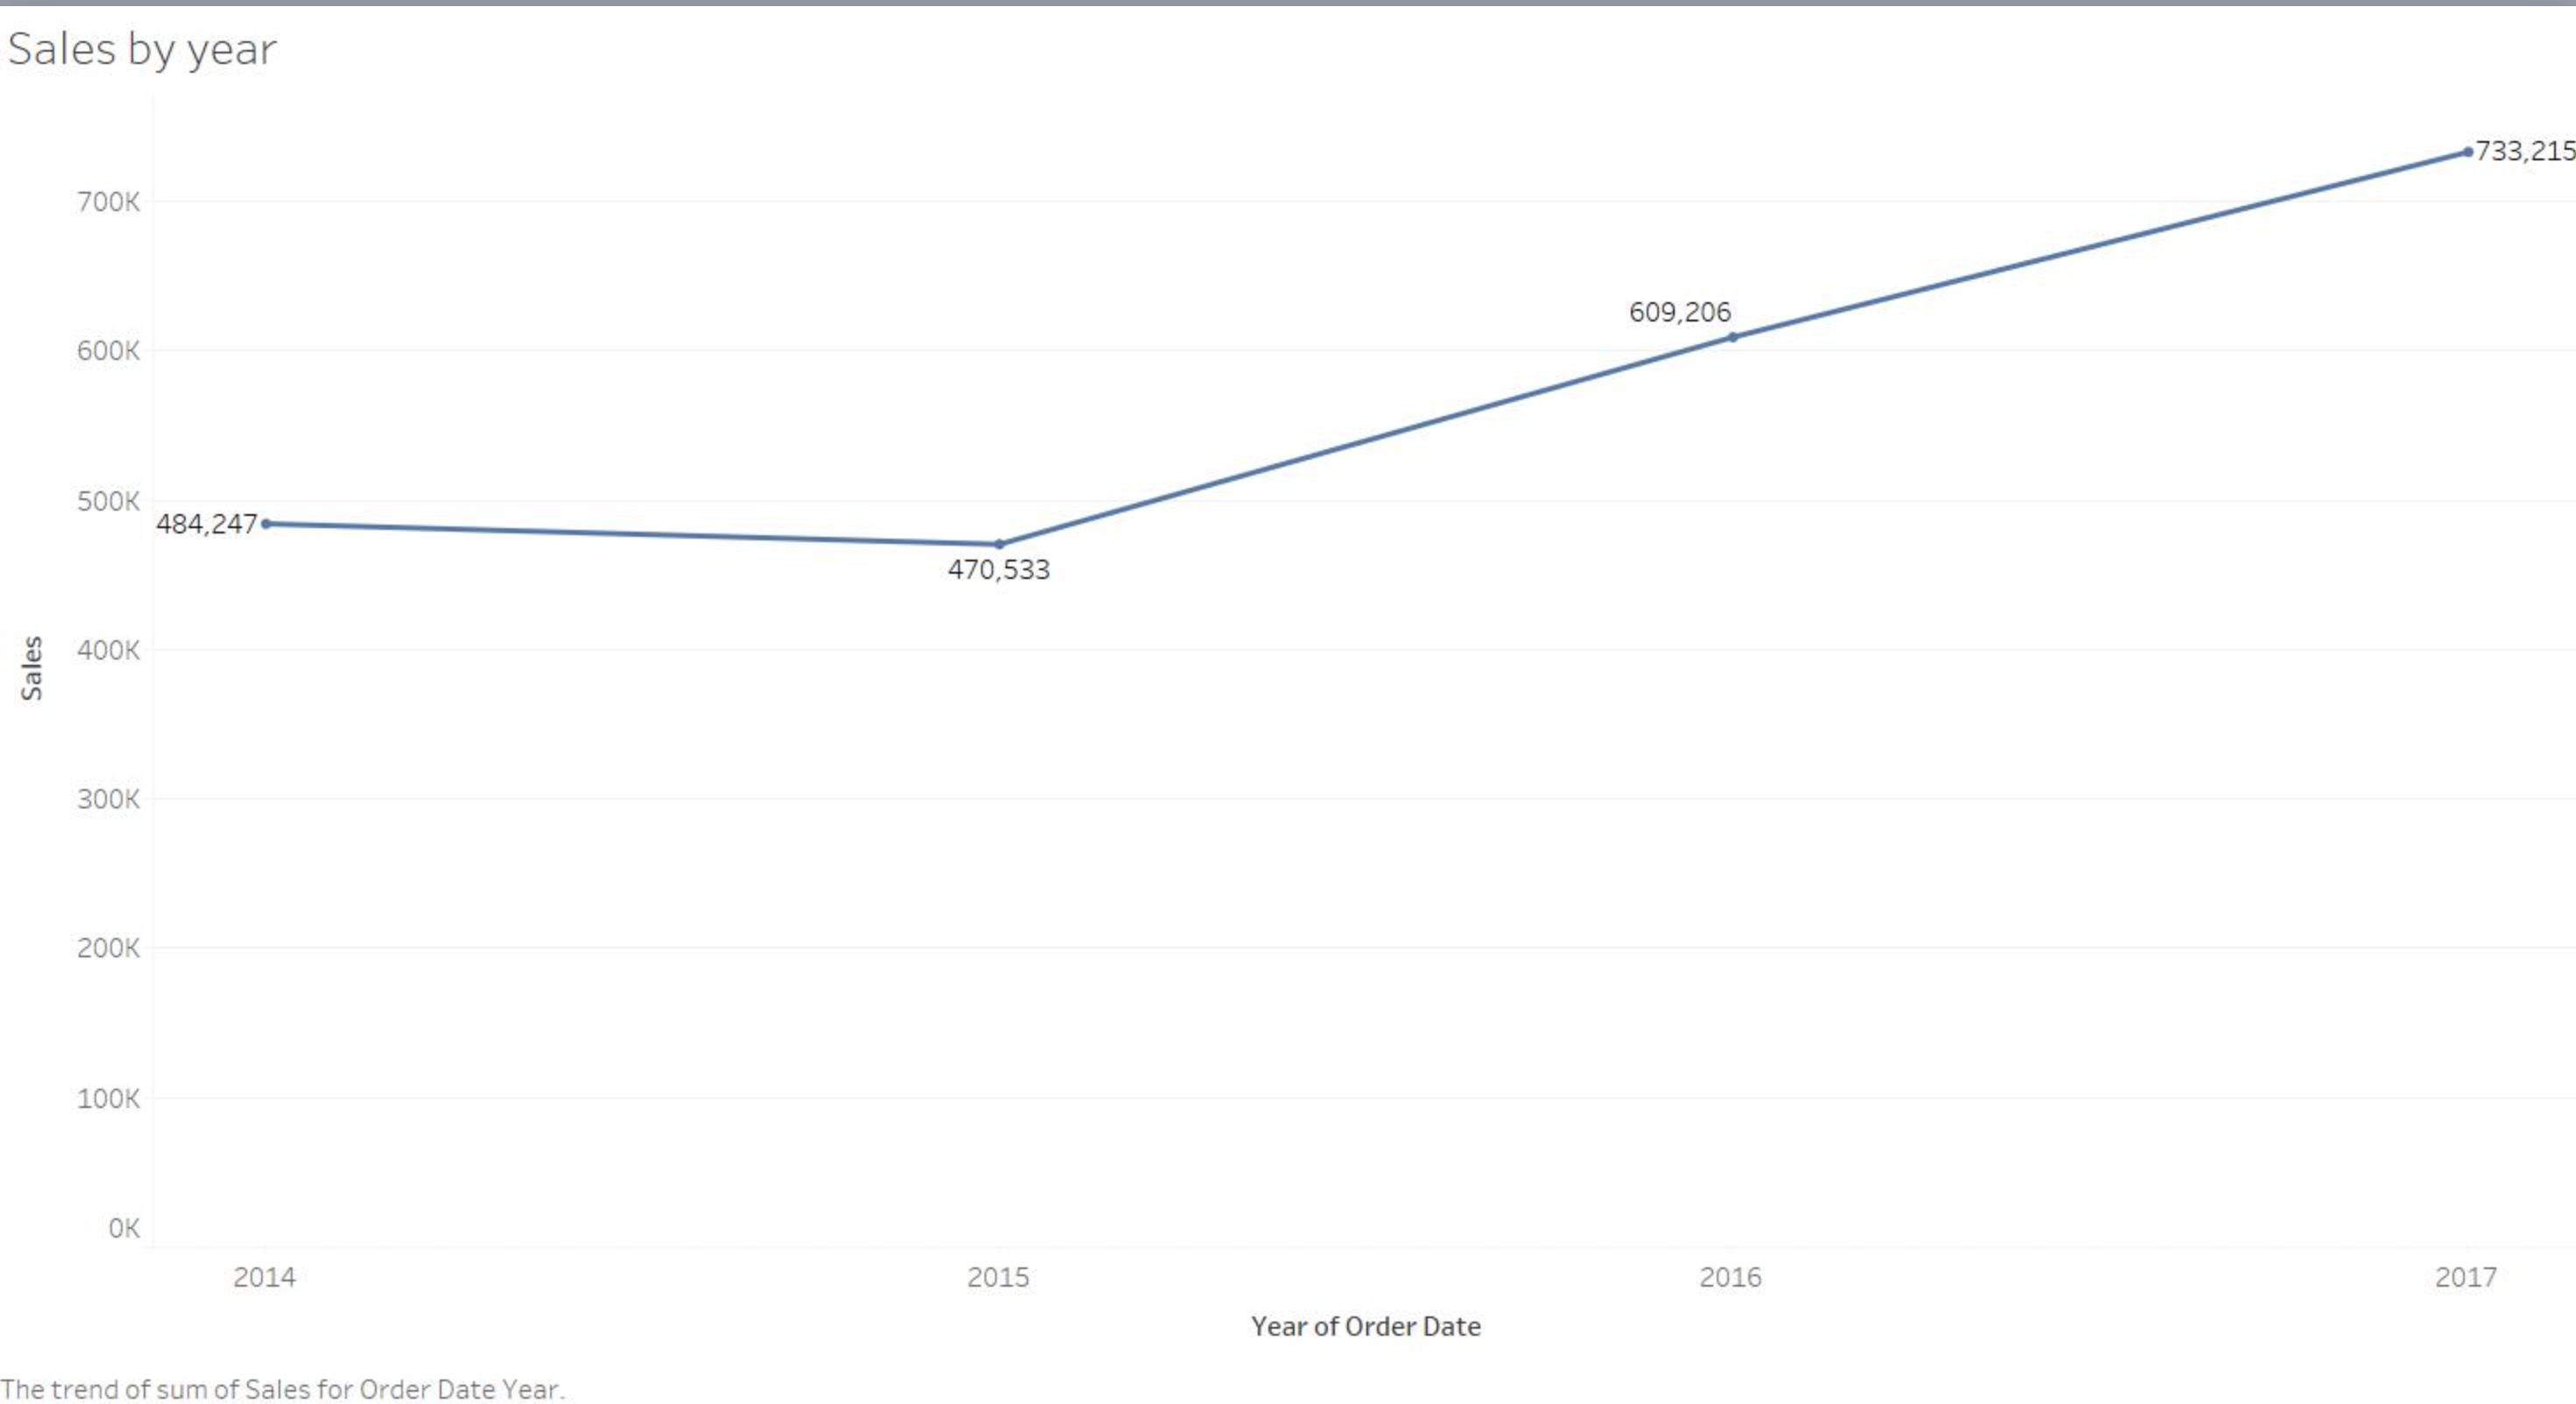
- With the time series illustrated using an annual frequency, is there any visible trend? Include a visualization and comment thereon in this document.
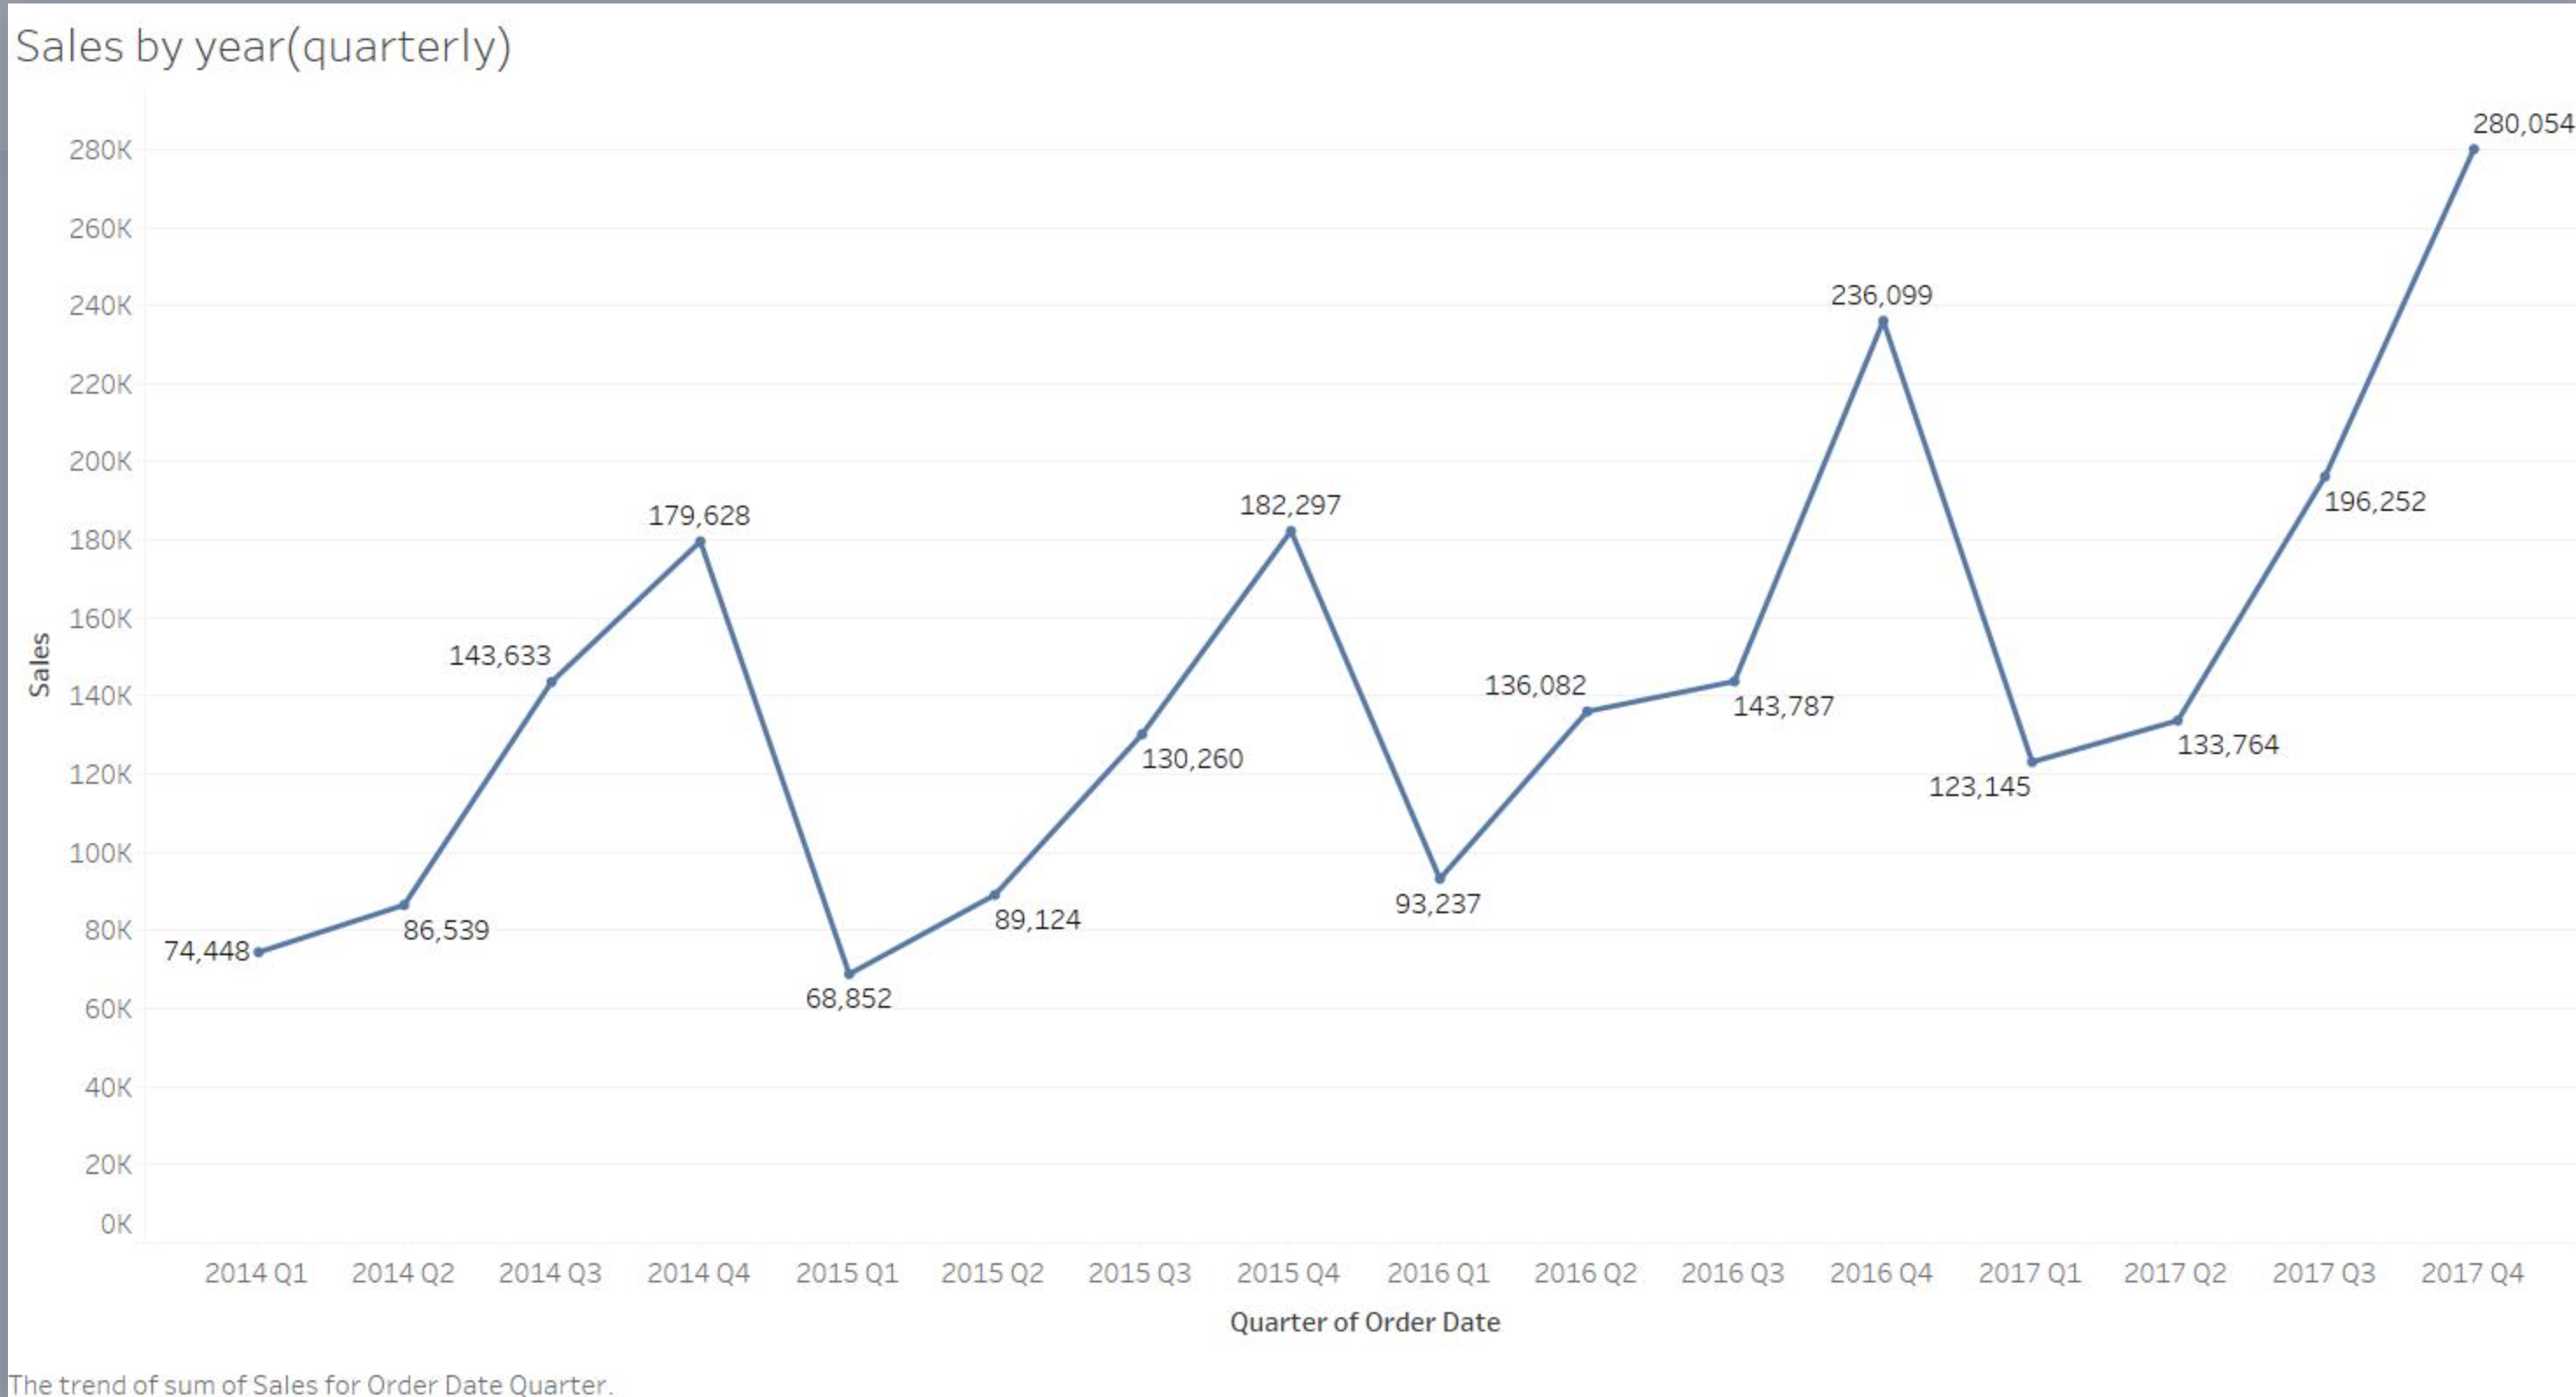
- Changing the frequency to quarterly, are any cycles or seasonality observed? Include a visualization and comment thereon in this document.
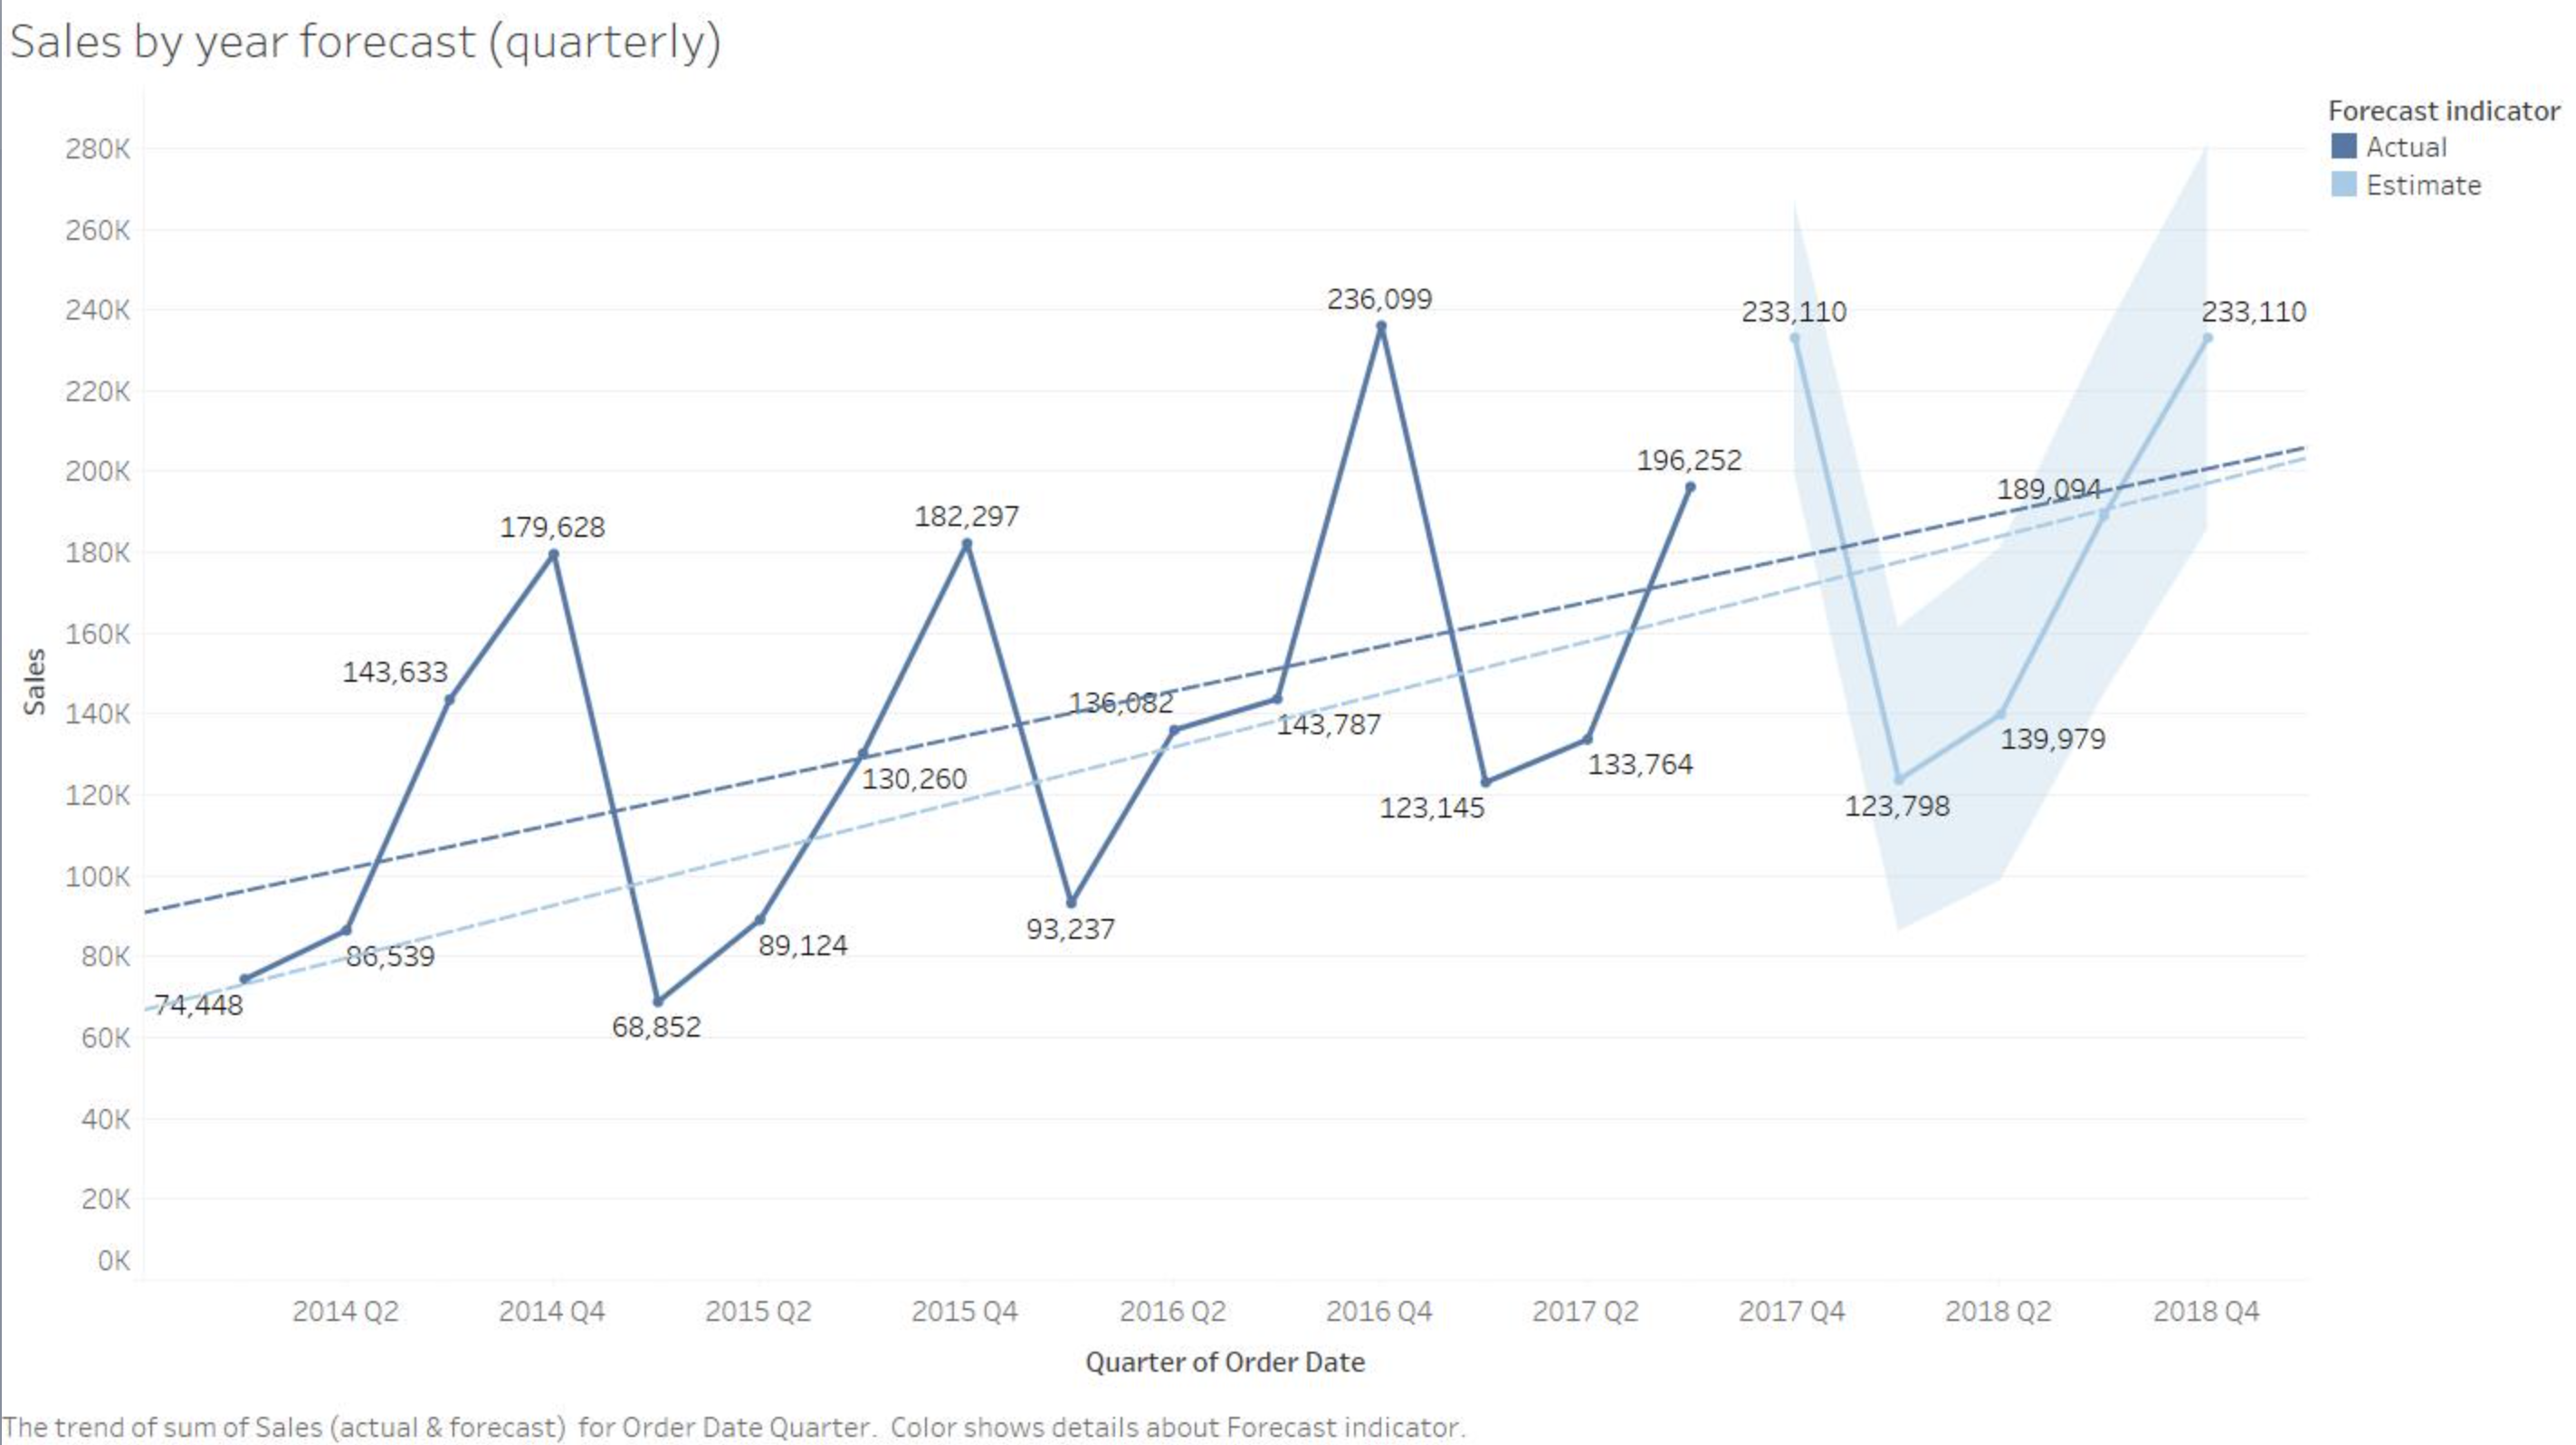
- Continuing with the time series using a quarterly frequency, navigate to the "Analytics" tab and perform a forecast. Also, add a linear trend line to the time series. Insert the visualization into this document and comment on the trend (or regression) line's R-squared and p-value, as well as the forecasted sum of sales for the next year compared to the previous year.
Question 2: Assess prediction performance
Using the same forecasting model produced in Question 1, navigate to "describe forecast" and answer the following questions:
- Under the summary tab, what percentage contribution have seasonality and trend made to this forecast? What is the quality of this forecast, and what is the projected change of the sum of sales between Q4 in 2017 and Q4 in 2018?
- Navigating to the "Model" tab, what is the root mean square error (RMSE) for this forecast? Suppose two other forecasts have been performed using the same data, with root mean square errors of 19.2 and 18.5, respectively. Which of the three forecasts would be the one you would identify as the most reliable, and why?
Step by Step Solution
There are 3 Steps involved in it
Step: 1

Get Instant Access to Expert-Tailored Solutions
See step-by-step solutions with expert insights and AI powered tools for academic success
Step: 2

Step: 3
Ace Your Homework with AI
Get the answers you need in no time with our AI-driven, step-by-step assistance
Get Started
Calculus
Authors: Dale Varberg, Edwin J. Purcell, Steven E. Rigdon
9th edition
131429248, 978-0131429246