Answered step by step
Verified Expert Solution
Question
1 Approved Answer
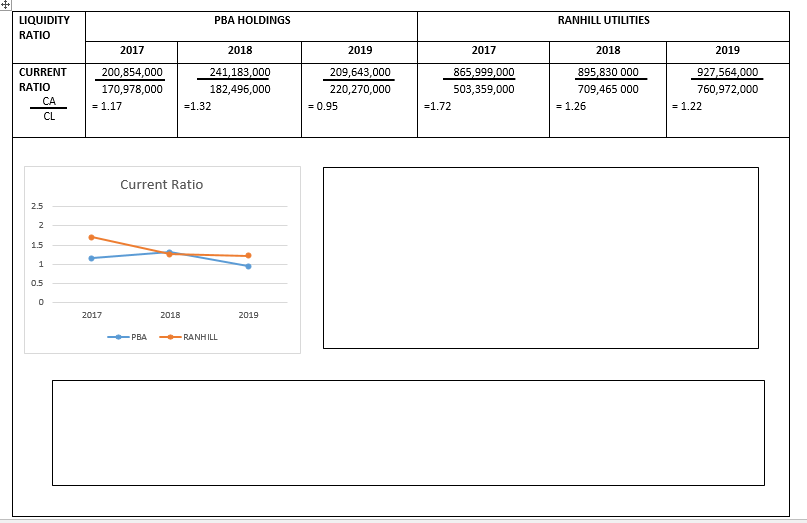
Question 1 Provide the explanation of the Trend Analysis and Comparison Analysis of each year for each company. PBA HOLDINGS RANHILL UTILITIES LIQUIDITY RATIO 2017

Question 1
Provide the explanation of the Trend Analysis and Comparison Analysis of each year for each company.
PBA HOLDINGS RANHILL UTILITIES LIQUIDITY RATIO 2017 2018 2019 2017 2018 2019 CURRENT RATIO CA CL 200,854,000 170,978,000 = 1.17 241,183,000 182,496,000 =1.32 209,643,000 220,270,000 = 0.95 865,999,000 503,359,000 -1.72 895,830 000 709,465 000 = 1.26 927,564,000 760,972,000 = 1.22 Current Ratio 2.5 2 1.5 1 0.5 0 2017 2018 2019 RANHILLStep by Step Solution
There are 3 Steps involved in it
Step: 1

Get Instant Access to Expert-Tailored Solutions
See step-by-step solutions with expert insights and AI powered tools for academic success
Step: 2

Step: 3

Ace Your Homework with AI
Get the answers you need in no time with our AI-driven, step-by-step assistance
Get Started


