

Question: Question 1 Question 1 (11 marks) Amplitude 3 2 10 20 () Figure 1 The graph in Figure 1 is the response y(t) of
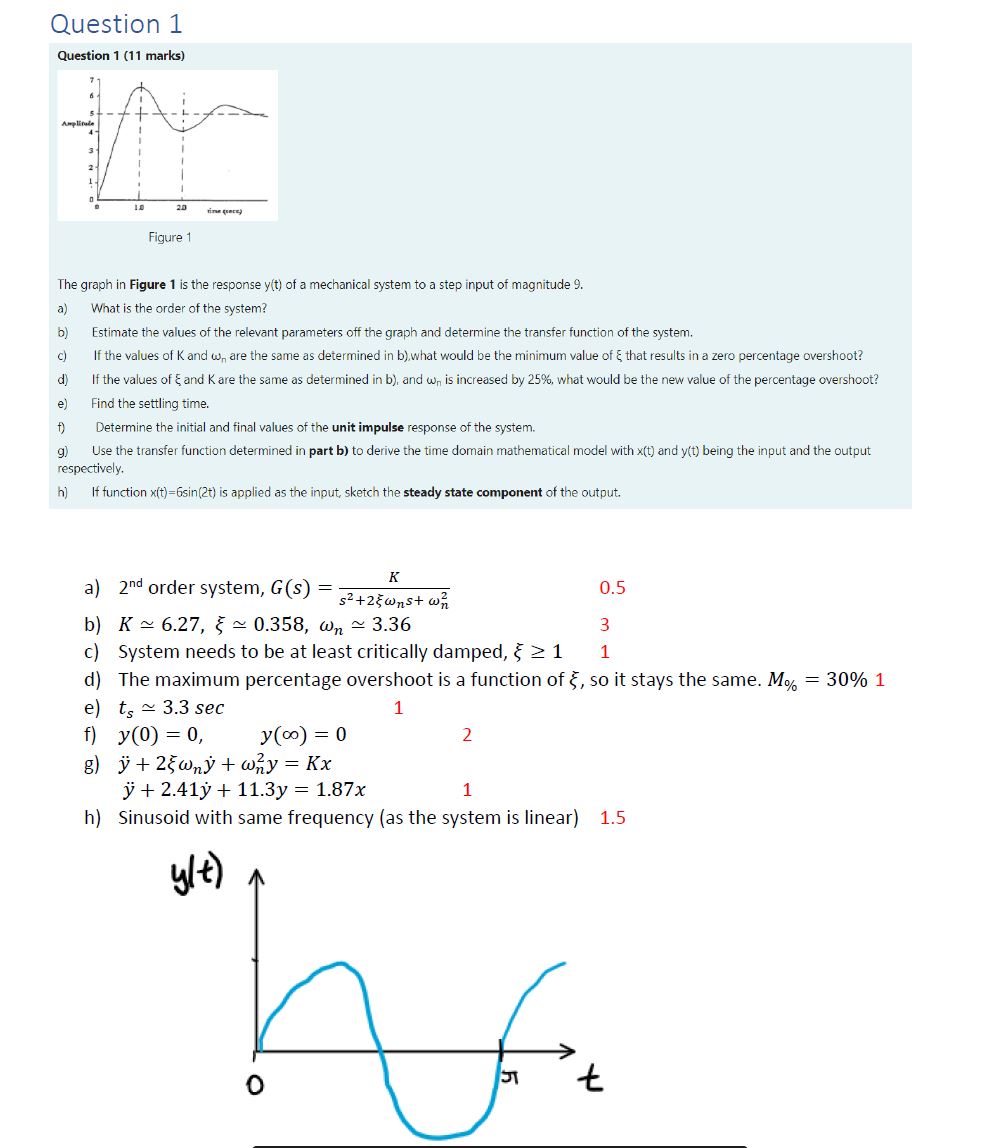
Question 1 Question 1 (11 marks) Amplitude 3 2 10 20 () Figure 1 The graph in Figure 1 is the response y(t) of a mechanical system to a step input of magnitude 9. If the values of K and w, are the same as determined in b),what would be the minimum value of & that results in a zero percentage overshoot? a) What is the order of the system? b) Estimate the values of the relevant parameters off the graph and determine the transfer function of the system. c) d) e) f) g) If the values of & and K are the same as determined in b), and w, is increased by 25%, what would be the new value of the percentage overshoot? Find the settling time. Determine the initial and final values of the unit impulse response of the system. Use the transfer function determined in part b) to derive the time domain mathematical model with x(t) and y(t) being the input and the output respectively. h) If function x(t)=6sin(2t) is applied as the input, sketch the steady state component of the output. K a) 2nd order system, G(s) = b) K 6.27, 0.358, w s+2\wns+ w 3.36 0.5 3 1 c) System needs to be at least critically damped, 1 d) The maximum percentage overshoot is a function of 5, so it stays the same. M% = 30% 1 e) ts 3.3 sec f) y(0) = 0, 1 y(0) = 0 2 g) +2w+way = Kx y+2.41 + 11.3y = 1.87x 1 h) Sinusoid with same frequency (as the system is linear) 1.5 y/t) h 0 t
Step by Step Solution
There are 3 Steps involved in it

Get step-by-step solutions from verified subject matter experts