Question
Prepare a business report, to the board of directors of Marks & Spencers Plc with tables and graphs that analyse the performance and financial position
Prepare a business report, to the board of directors of Marks & Spencers Plc with tables and graphs that analyse the performance and financial position over at least 5 financial years and recommend actions that the board should take. Utilise search data about the subject company and its competitor(s) from university databases (FAME, MINTEL and Marketline Advantage) examined during seminars as well as the company financial reports and a range of other sources that you are to find for yourself. Organise the ratios into 4 categories (Profitability, Liquidity, Efficiency, and Gearing) and calculate horizontal and vertical analysis. Apart from the graphs, put all the ratios, tables, and analysis in appendices. Your 6-page business report must include in-depth critical discussion with appropriate academic references and graphs.
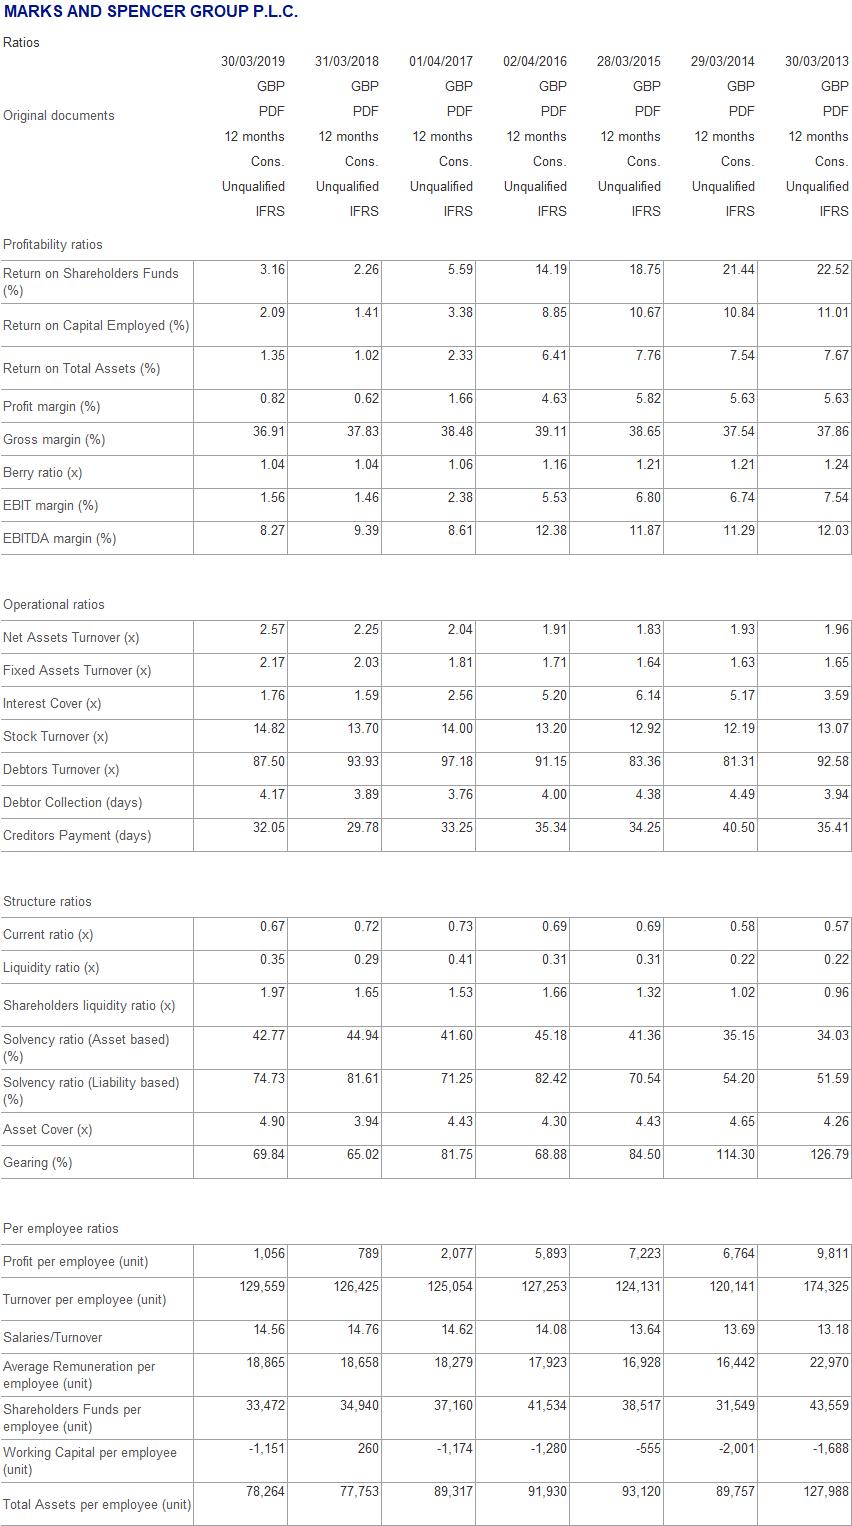
MARKS AND SPENCER GROUP P.L.C. Ratios Original documents Profitability ratios Return on Shareholders Funds (%) Return on Capital Employed (%) Return on Total Assets (%) Profit margin (%) Gross margin (%) Berry ratio (x) EBIT margin (%) EBITDA margin (%) Operational ratios Net Assets Turnover (x) Fixed Assets Turnover (x) Interest Cover (x) Stock Turnover (x) Debtors Turnover (x) Debtor Collection (days) Creditors Payment (days) Structure ratios Current ratio (x) Liquidity ratio (x) Shareholders liquidity ratio (x) Solvency ratio (Asset based) (%) Solvency ratio (Liability based) (%) Asset Cover (x) Gearing (%) Per employee ratios Profit per employee (unit) Turnover per employee (unit) Salaries/Turnover Average Remuneration per employee (unit) Shareholders Funds per employee (unit) Working Capital per employee (unit) Total Assets per employee (unit) 30/03/2019 GBP PDF 12 months Cons. Unqualified IFRS 3.16 2.09 1.35 0.82 36.91 1.04 1.56 8.27 2.57 2.17 1.76 14.82 87.50 4.17 32.05 0.67 0.35 1.97 42.77 74.73 4.90 69.84 1,056 129,559 14.56 18,865 33,472 -1,151 78,264 31/03/2018 GBP PDF 12 months Cons. Unqualified IFRS 2.26 1.41 1.02 0.62 37.83 1.04 1.46 9.39 2.25 2.03 1.59 13.70 93.93 3.89 29.78 0.72 0.29 1.65 44.94 81.61 3.94 65.02 789 126,425 14.76 18,658 34,940 260 77,753 01/04/2017 GBP PDF 12 months Cons. Unqualified IFRS 5.59 3.38 2.33 1.66 38.48 1.06 2.38 8.61 2.04 1.81 2.56 14.00 97.18 3.76 33.25 0.73 0.41 1.53 41.60 71.25 4.43 81.75 2,077 125,054 14.62 18,279 37,160 -1.174 89,317 02/04/2016 GBP PDF 12 months Cons. Unqualified IFRS 14.19 8.85 6.41 4.63 39.11 1.16 5.53 12.38 1.91 1.71 5.20 13.20 91.15 4.00 35.34 0.69 0.31 1.66 45.18 82.42 4.30 68.88 5,893 127,253 14.08 17,923 41,534 -1,280 91,930 28/03/2015 GBP PDF 12 months Cons. Unqualified IFRS 18.75 10.67 7.76 500 5.82 38.65 1.21 6.80 11.87 1.83 1.64 6.14 12.92 83.36 4.38 34.25 0.69 0.31 1.32 41.36 70.54 4.43 84.50 7,223 124,131 13.64 16,928 38,517 -555 93,120 29/03/2014 GBP PDF 12 months Cons. Unqualified IFRS 21.44 10.84 7.54 5.63 37.54 1.21 6.74 11.29 1.93 1.63 5.17 12.19 81.31 4.49 40.50 0.58 0.22 1.02 35.15 54.20 4.65 114.30 6,764 120,141 13.69 16,442 31,549 -2,001 89,757 30/03/2013 GBP PDF 12 months Cons. Unqualified IFRS 22.52 11.01 7.67 5.63 37.86 1.24 7.54 12.03 1.96 1.65 3.59 13.07 92.58 3.94 35.41 0.57 0.22 0.96 34.03 51.59 4.26 126.79 9,811 174,325 13.18 22,970 43,559 -1,688 127,988
Step by Step Solution
3.36 Rating (152 Votes )
There are 3 Steps involved in it
Step: 1
Ratio Analysis for the Past Five Years Return on Assets ROA The return on asset is a profitability r...
Get Instant Access to Expert-Tailored Solutions
See step-by-step solutions with expert insights and AI powered tools for academic success
Step: 2

Step: 3

Ace Your Homework with AI
Get the answers you need in no time with our AI-driven, step-by-step assistance
Get Started


