

Answered step by step
Verified Expert Solution
Question
1 Approved Answer
Question 1 - Retail sales data are reported in millions of dollars, covering 40 quarters, starting with the fiscal year 2006 and ending in the
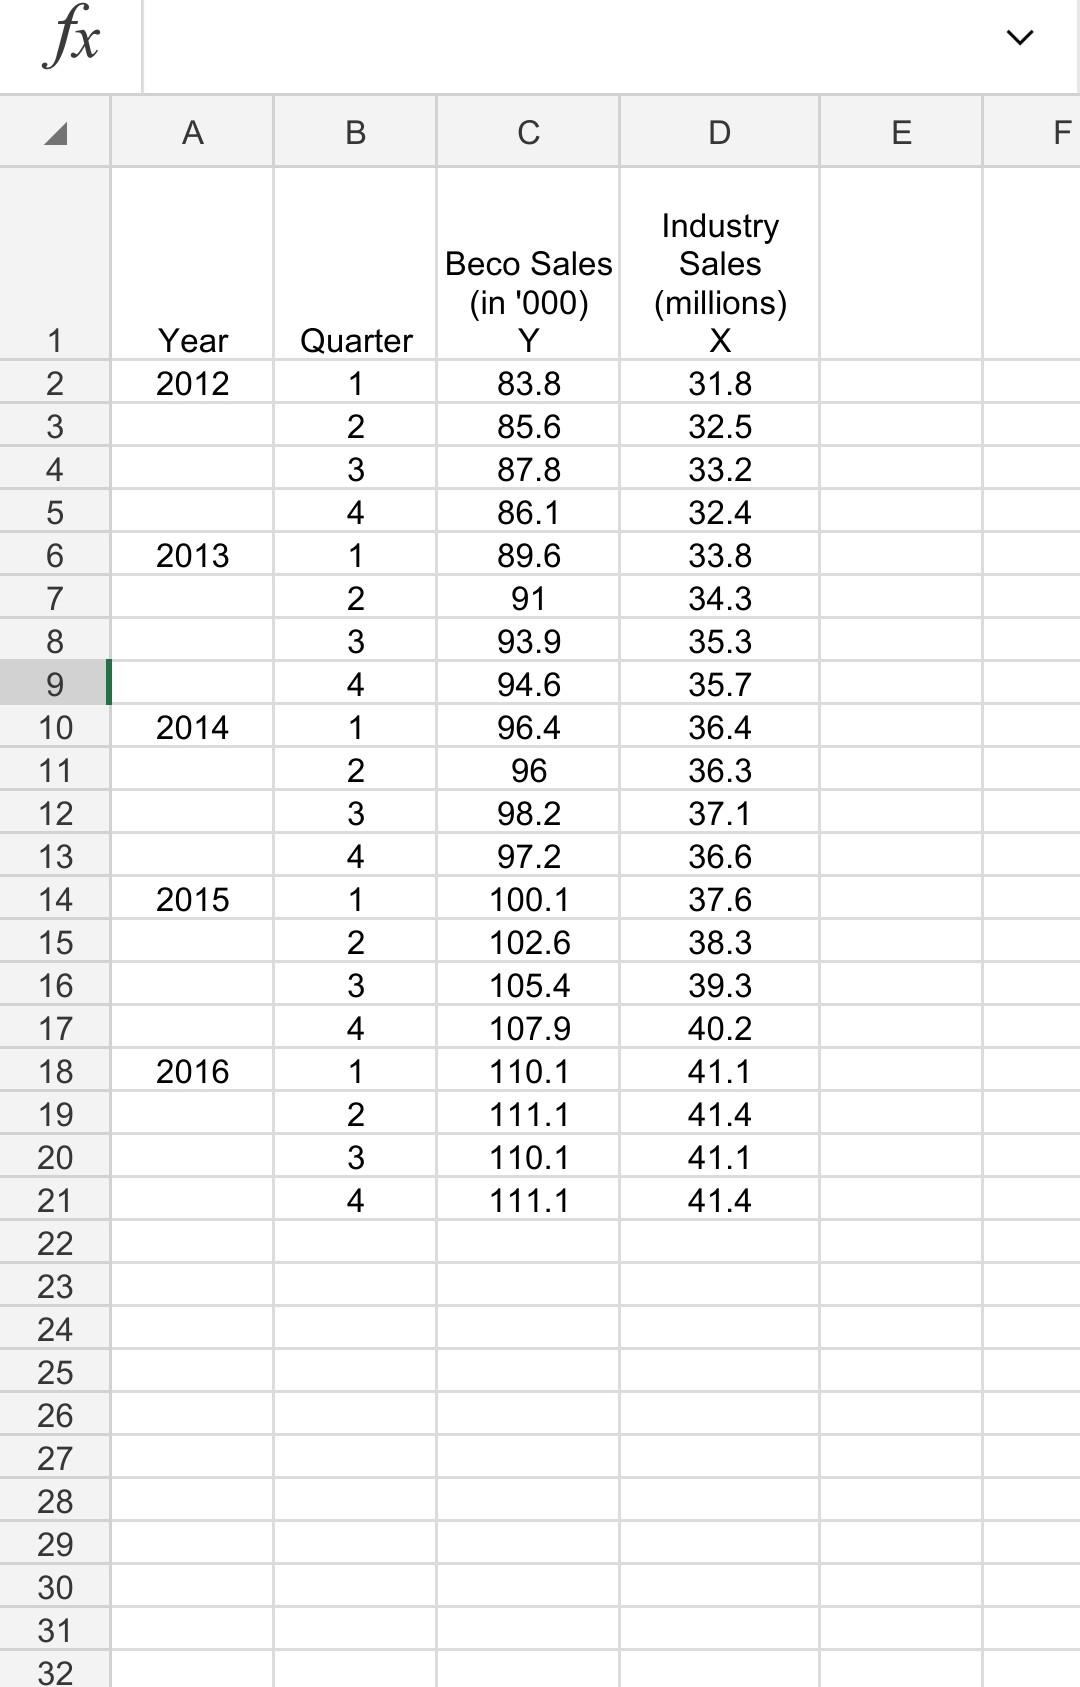
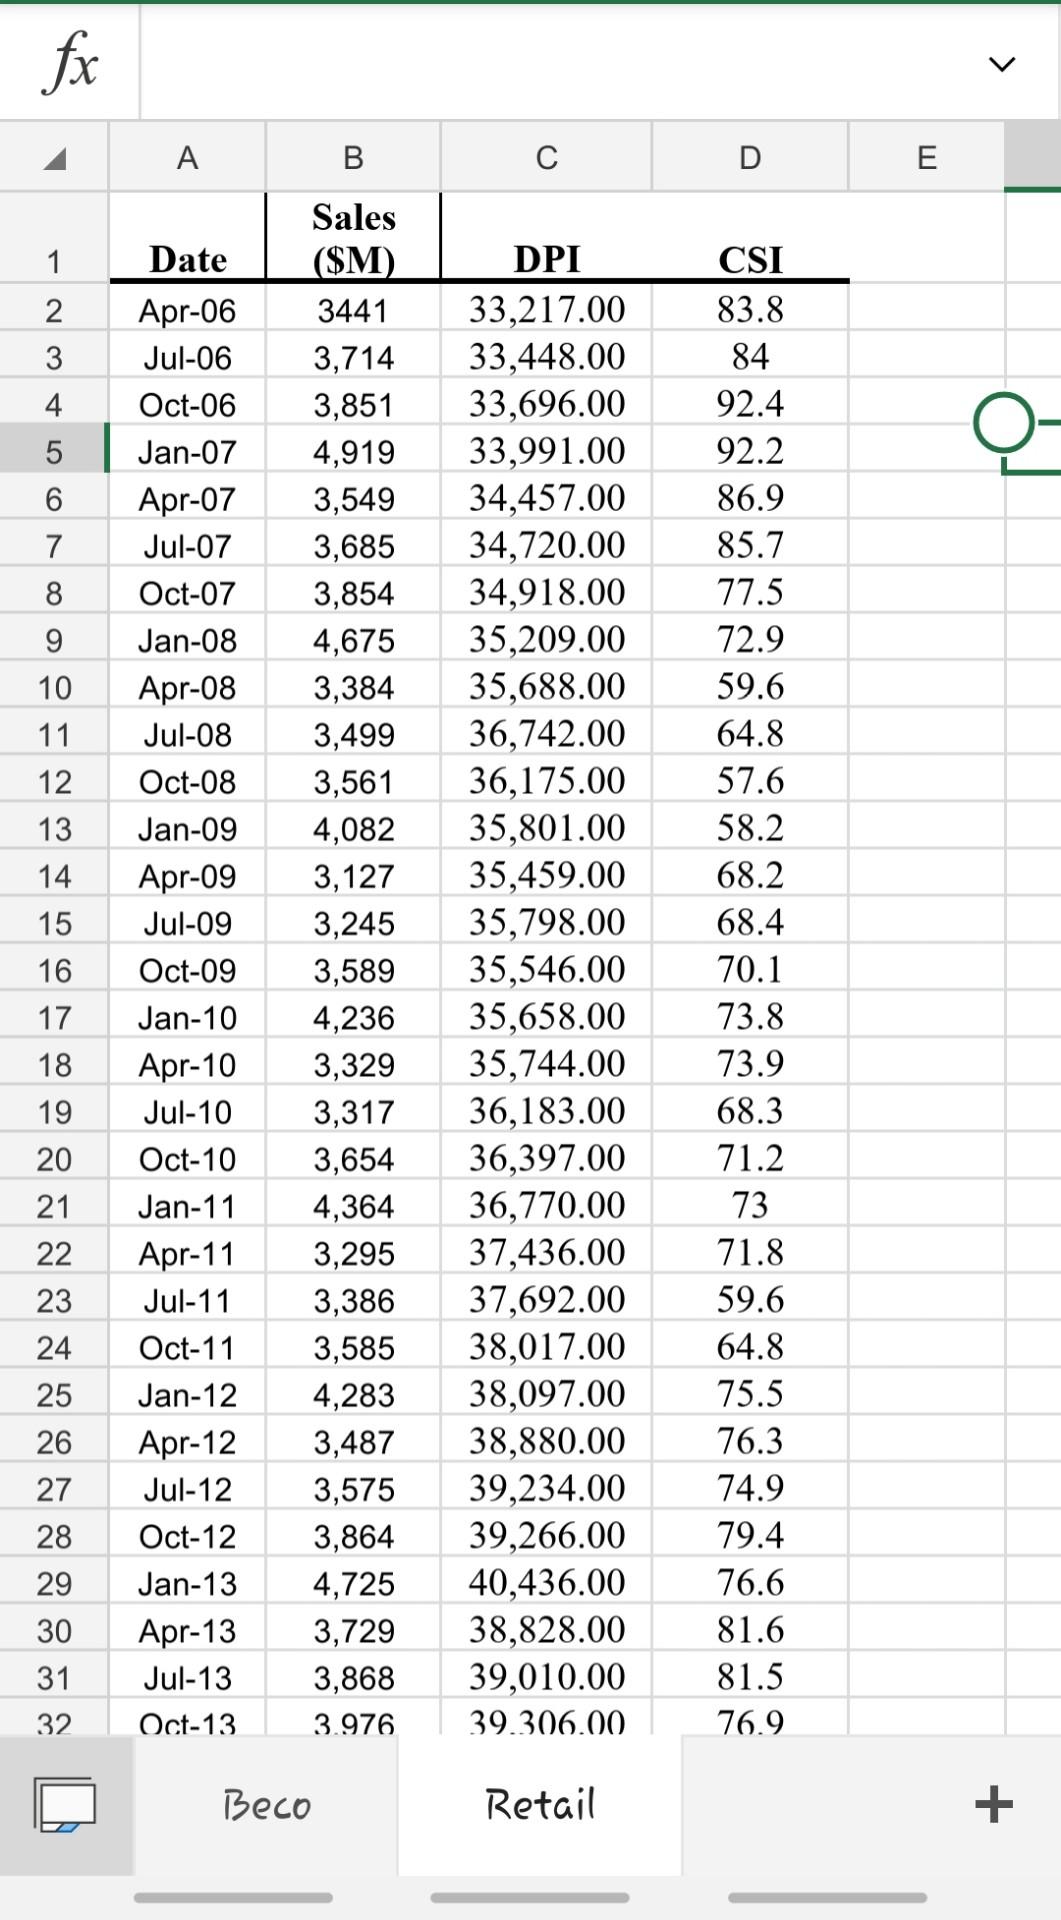
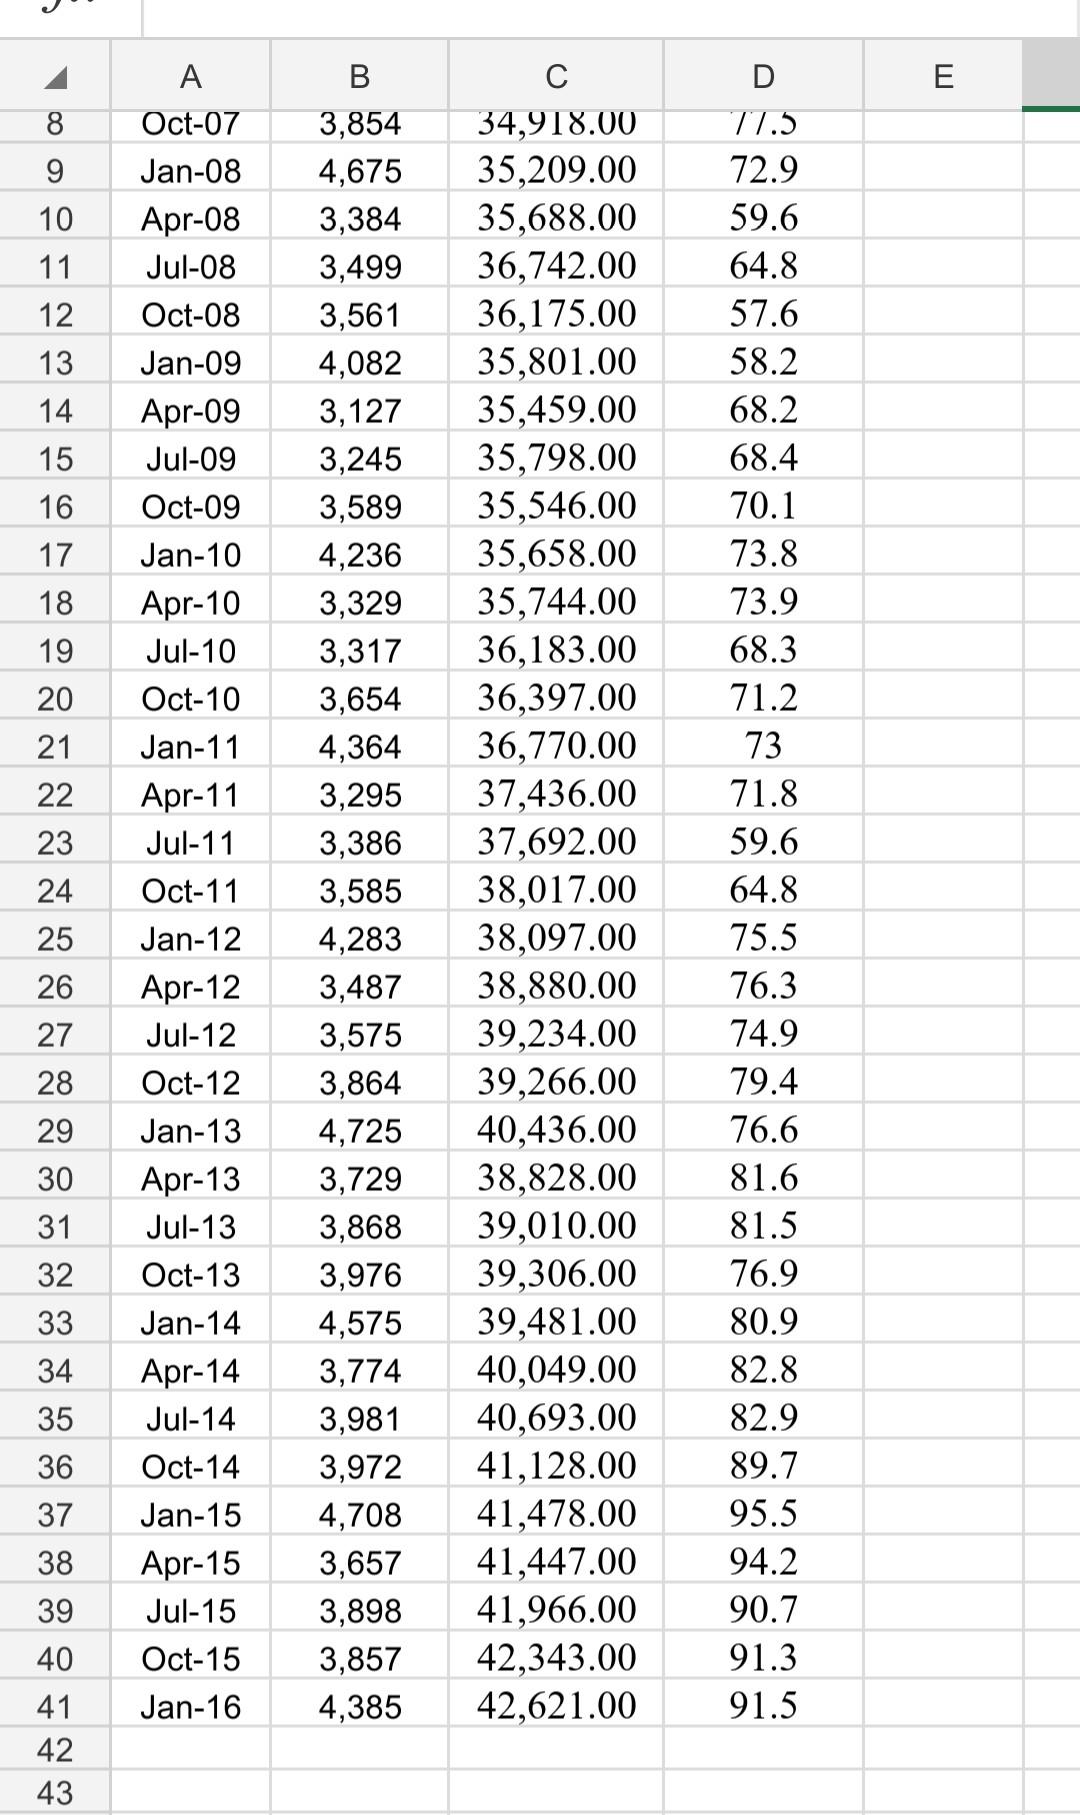
Question 1 - Retail sales data are reported in millions of dollars, covering 40 quarters, starting with the fiscal year 2006 and ending in the fiscal year 2015, in the data set Retail.xls Part A - Explore this retail time series using the following plots: a time plot, a seasonal plot, an ACF plot. Discuss the results: Part B - Develop a regression model to forecast for future the retail sales, using the first 36 quarters as training data. Make sure to include independent variable(s) accounting for pattern(s) identified in the series. Also, consider DPI: disposable personal income per capita, and CSI: Consumer Sentiment Index, as potential predictors for your model. Conduct an analysis on prospective forecast models (more than 1, less than 5) that you fit to your data, such that they are each examined for statistical significance, goodness-of-fit, and that the IC (information criteria) measures are also examined for each prospective model. What is your best forecast model for retail sales? Part C - What are the accuracy measures of your prospective models in Part B? Part D- Does your selected forecast model have autocorrelation? How can you check? If it does have autocorrelation, what are potential ways to "fix" for this problem. Question 2 - Assuming that the data contained in the file Beco.xls shows seasonally adjusted quarterly sales for Beco Furniture and for the entire furniture industry for 20 quarters, solve for the following questions: Part A - Fit a linear regression model with all observations and present a residual analysis with supporting plots. What are your conclusions? Part B - Calculate the Durbin-Watson statistic and determine whether autocorrelation exists. Part C - Estimate the regression coefficient B1, using generalized differences (ie: estimate the first order autocorrelation coefficient, p, with the lag 1 residual autocorrelation coefficient). Part D - Compare the standard errors and p-values of the two estimates of 1, obtained using the original data and the generalized differences. Which estimate is more accurate? Explain. fx
Step by Step Solution
There are 3 Steps involved in it
Step: 1

Get Instant Access to Expert-Tailored Solutions
See step-by-step solutions with expert insights and AI powered tools for academic success
Step: 2

Step: 3
Ace Your Homework with AI
Get the answers you need in no time with our AI-driven, step-by-step assistance
Get Started
AQA AS Accounting Unit 1 Introduction To Financial Accounting
Authors: Brendan Casey
1st Edition
1499789653, 978-1499789652