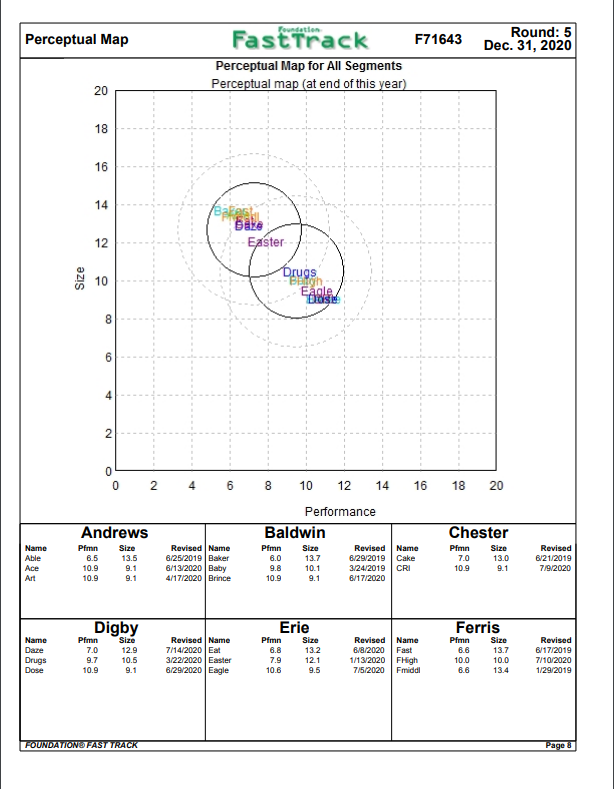
Question (1) Review the material from Competitive Strategies. Use the attached FastTrack to analyze the competitive strategies of Erie by answering the following questions. Explain the reasons and justification for your answers using as evidence information from the FastTrack. 1) Which segment(s) does the company have presence in? How many products per segment? (2 points) 2) Examine the functional tactics for each product (R&D performance, size, MTBF, age; Marketing price, promotion and sales budgets, percentage of awareness and accessibility; Production cost structure as reflected in contribution margin, labor cost and automation) (18 points) 3) Based on the functional tactics above, make a conclusion about the companys competitive strategy for each product whether cost leadership or differentiation (6 points) 4) From your answer above, does the company have a single strategy for all of its products? Does the company have a single strategy for all products in a segment? How would you name the overall competitive strategy of the company? (8 points) Hint: you do not have to pick one of the strategies explained. You can make up a name that describes what the company is doing, as it may not fit perfectly one of the six competitive strategies.
Question (2) Conduct a full SWOT analysis for company Andrews and company Erie. Explain at least 2 strengths, 2 weaknesses, 2 opportunities and 2 strengths for each company. Remember that strengths and weaknesses come from factors inside the company that the company can control to a great extent. On the other hand, opportunities and threats come from factors external to the company and are therefore not entirely under its control.
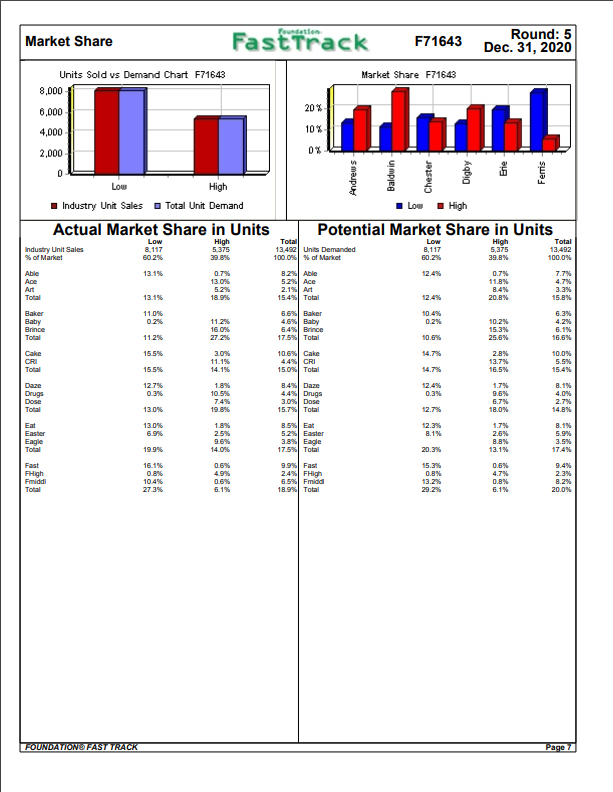
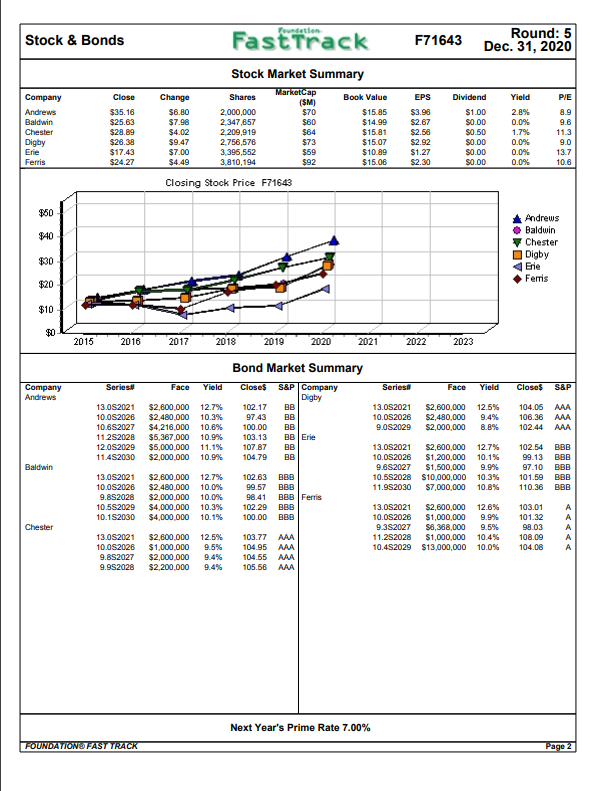
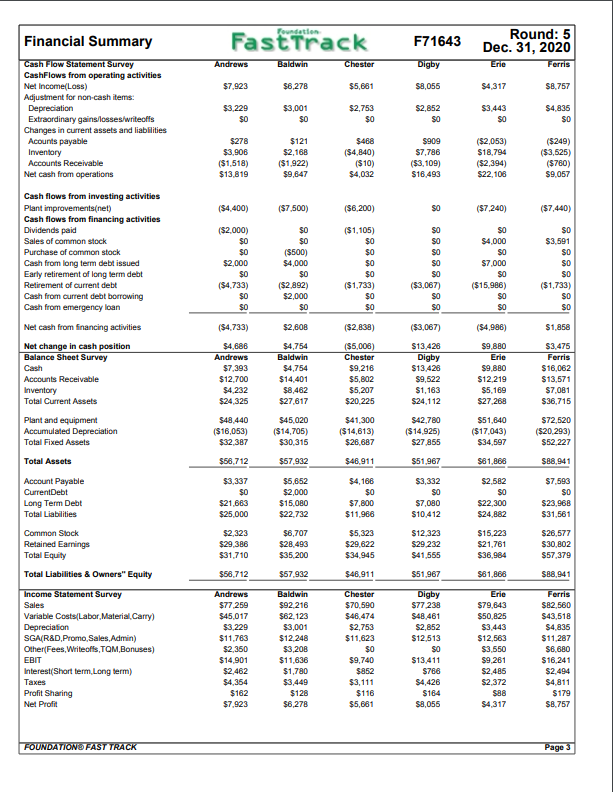
Question (3) Compare the performance of the two companies: Andrews and Erie on the following performance outcomes and measures: Sales and Sales growth (put in mind that all companies started out with $40 million in sales and the industry was growing at an average of 15% per year) 4 Profits 2 Profitability (ROS, Net Margin and Contribution Margin) 6 Costs (Labor and material costs) 4 SG&A (absolute value and as a percentage of sales revenue) 4 Asset turnover (how efficiently the assets of the company are being used to generate sales) 4 Market Share 2 Stock price 2 Capital Structure 2 Comment on the variation between the two companies and offer recommendations for improvement for the weaker company.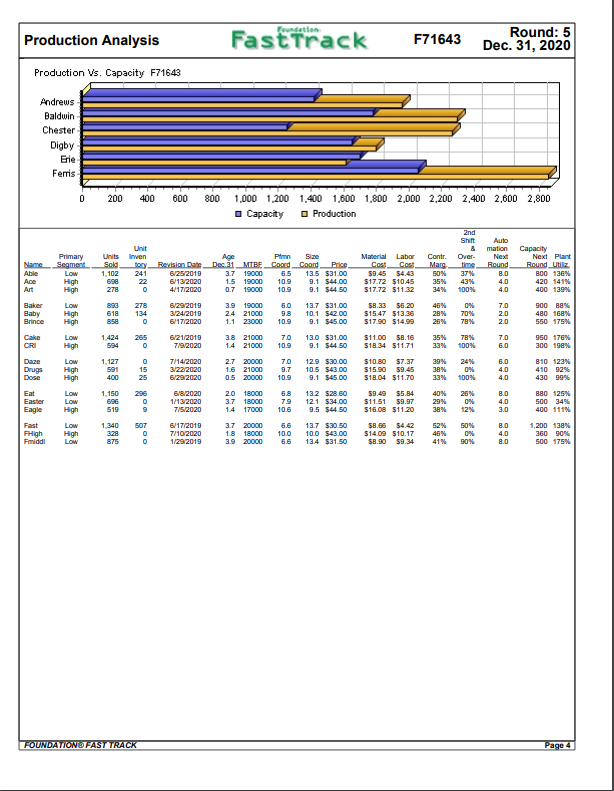
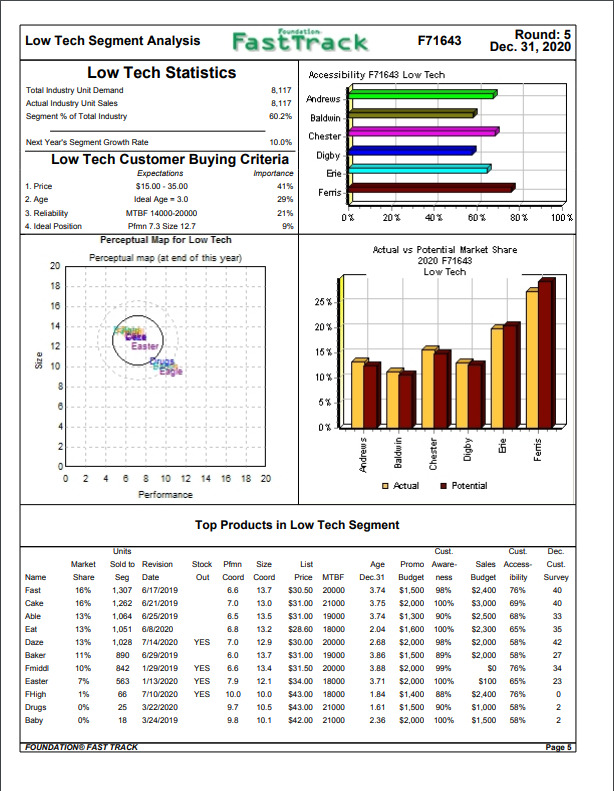
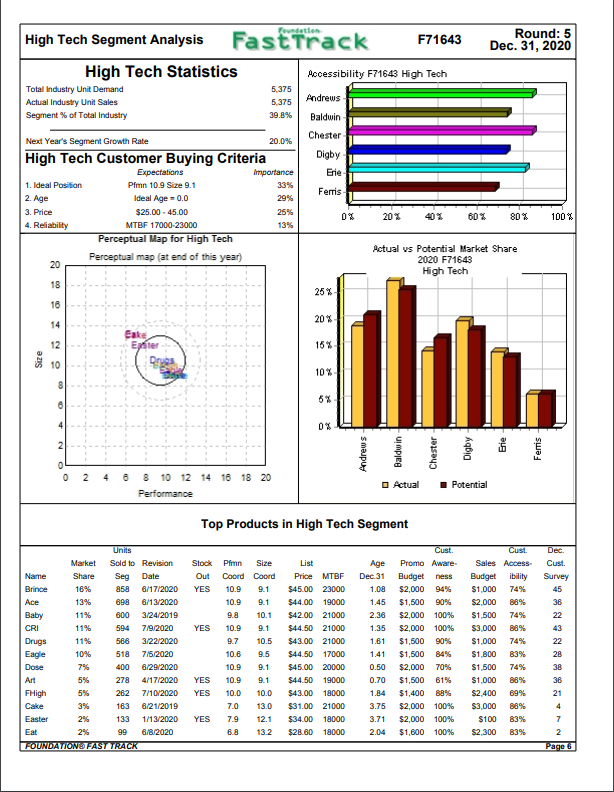
Foundation Production Analysis Fast Track F71643 Round: 5 Dec. 31, 2020 Production Vs. Capacity F71643 Andrews Baldwin Chester Digby Erie Ferris D 200 400 600 800 1,000 1,200 1,400 1,600 1,800 2,000 2,200 2,400 2,600 2,800 o Capacity Production 2nd Shin Over- Units Sold 1.102 600 278 Unit Inven tocy 241 Material Labor Cost Cost $9.45 $4.43 $17.72 510.45 $17.72 511 32 Contr Marg 50% 35% 34% Capacity Next Plant Round Utiliz 800 130% 420 141% 400 139% 37% 43N 100% 890 618 Auto mation Next Round 8.0 4.0 4.0 7.0 2.0 2.0 7.0 6.0 278 134 0 $8.33 $6.20 $15.47 $13.36 $17.90 $14.99 46% 28% 26% 0% 70% 78% 900 88% 480 168% 550 175 Primary Name Segment Able Low Ace High Art High Baker Low Baby High Brince High Low High Daze Low Drugs Dose High Eat Low Easter Low Eagle High Fast Low FHigh High Friddi LOW 1424 594 35% 33% Age Prim Size Revision Date Dec.31 MTBE CoordCoord Price 6/25/2019 3.7 19000 6.5 13.5 $31.00 6/13/2020 15 19000 10.9 9.1 544.00 4/17/2020 0.7 19000 10.9 9.1 $44.50 6/29/2019 3.9 19000 13.7 $31.00 3/24/2019 24 21000 10.1 $42.00 6/17/2020 1.1 23000 10.9 9.1 $45.00 6/21/2019 3.8 21000 13.0 $31.00 7/92020 1.4 21000 10.9 9.1 $44.50 7/14/2020 2.7 20000 129 $30.00 3/22/2020 1.6 21000 9.7 10.5 $43.00 6/29/2020 0.5 20000 10.9 9.1 $45.00 6/8/2020 20 18000 132 $28.60 1/13/2020 3.7 18000 7.9 12.1 $34.00 7/5/2020 1.4 17000 106 9.5 $44.50 6/17/2019 3.7 20000 13.7 $30.50 7/10/2020 1.8 18000 10.0 100 $43.00 1/29/2019 3.9 20000 13.4 $31.50 $11.00 $8.16 $18.34 $11.71 78% 100% 950 170% 300 198% High 15 591 400 39% 389 33% 24% 0% 100% 4.0 4.0 810 123 410 92% 430 99% $10.80 $7.37 $15.90 $9.45 $18.04 $11.70 $9.49 55.84 $11.51 $9.97 $16.08 $11.20 1.150 40% 29% 38% 26% 0% 12% 880 125% 500 34% 400 111% 519 4.0 3.0 9 1.340 328 875 507 0 0 $8.66 $14.09 $10.17 $8.90 $9.34 52% 46% 41% 50% 0% 90% 4.0 1,200 138% 360 90% 500 175% FOUNDATION FAST TRACK Page 4 Low Tech Segment Analysis Fast Track Round: 5 F71643 Dec. 31, 2020 Low Tech Statistics Accessibility F71643 Low Tech Total Industry Unit Demand 8.117 Actual Industry Unit Sales 8.117 Andrews Segment % of Total Industry 60.2% Baldwin Next Year's Segment Growth Rate Chester 10.0% Low Tech Customer Buying Criteria Digby Expectations Importance Erie 1. Price $15.00 - 35.00 41% Ferris Ideal Age = 3.0 29% 3. Reliability MTBF 14000-20000 21% 0% 20% 402 60% 80% 100% 4. Ideal Position Pfmn 7.3 Size 12.7 9% Perceptual Map for Low Tech Actual vs Potential Market Share Perceptual map (at end of this year) 20 2020 F71643 Low Tech 18 16 25% 2. Age 14 20% 12 15% Size 10 10% 8 8 5% 0% 2 0 0 N 4 6 8 10 12 14 16 18 20 Actual Potential Performance Top Products in Low Tech Segment Name Fast Cake Able Eat Dare Baker Fmidd Easter FHigh Drugs Baby Market Share 16% 16% 13% 13% 13% 11% 10% Units Sold to Revision Seg Date 1,307 6/17/2019 1,262 6/21/2019 1,084 6/25/2019 1,051 6/8/2020 1,028 7/14/2020 890 6/29/2019 842 1/29/2019 563 1/13/2020 66 7/10/2020 25 3/22/2020 18 3/24/2019 Stock Pfmn Size Out Coord Coord 6.6 13.7 7.0 13.0 6.5 13.5 6.8 13.2 YES 7.0 12.9 6.0 13.7 YES 6.6 13.4 YES 7.9 12.1 YES 10.0 10.0 9.7 10.5 9.8 10.1 List Price MTBF $30.50 20000 $31.00 21000 $31.00 19000 $28.60 18000 $30.00 20000 $31.00 19000 $31.50 20000 $34.00 18000 $43.00 18000 $43.00 21000 $42.00 21000 Age Dec 31 3.74 3.75 3.74 2.04 2.68 3.86 3.88 3.71 1.84 1.61 2.36 Cust. Promo Aware Budget ness $1,500 98% $2,000 100% $1,300 90% $1,600 100% $2,000 98% $1,500 89% $2,000 $2,000 100% $1,400 88% $1.500 90% $2,000 100% Cust. Sales Access Budget ibility $2.400 78% $3,000 69% $2.500 68% $2,300 65% $2.000 58% $2.000 58% SO 78% $100 65% $2.400 78% $1.000 58% $1,500 58% Dec. Cust. Survey 40 40 33 35 42 27 34 23 0 1% 0% NN FOUNDATION FASTTRACK Page 5 Foundation High Tech Segment Analysis Fast Track Round: 5 F71643 Dec. 31, 2020 High Tech Statistics Accessibility F71643 High Tech Total Industry Unit Demand 5,375 Actual Industry Unit Sales 5,375 Andrews Segment % of Total Industry 39.8% Baldwin Next Year's Segment Growth Rate 20.0% Chester High Tech Customer Buying Criteria Digby Expectations Importance Erie 1. Ideal Position Pfmn 10.9 Size 9.1 33% Ferris 2. Age Ideal Age = 0.0 29% 3. Price $25.00 - 45.00 25% 20% 60% 80% 100% 4. Reliability MTBF 17000-23000 13% Perceptual Map for High Tech Actual vs Potential Market Share Perceptual map (at end of this year) 20 2020 F71643 High Tech 18 25% 16 14 20% 12 ter 16% Size 10 10% 8 8 5% 0% 2 Andrews Ene Baldwin Chester Digby Ferris 0 0 2 4 6 8 10 12 14 16 18 20 Actual Potential Performance Top Products in High Tech Segment Units Market Sold to Revision Name Share Seg Date Brince 16% 858 6/17/2020 Ace 13% 698 6/13/2020 Baby 11% 600 3/24/2019 CRI 11% 594 7/9/2020 Drugs 11% 566 3/22/2020 Eagle 10% 518 7/5/2020 Dose 400 6/29/2020 Art 5% 278 4/17/2020 FHigh 5% 262 7/10/2020 Cake 3% 6/21/2019 Easter 133 1/13/2020 Eat 2% 99 6/8/2020 FOUNDATIONOFAST TRACK Stock Pfmn Size Out Coord Coord YES 10.9 9.1 10.9 9.1 9.8 10.1 YES 10.9 9.1 9.7 10.5 10.6 9.5 10.9 9.1 YES 10.9 9.1 YES 10.0 10.0 7.0 13.0 YES 7.9 12.1 6.8 13.2 List Price MTBF $45.00 23000 $44.00 19000 $42.00 21000 $44.50 21000 $43.00 21000 $44.50 17000 $45.00 20000 $44.50 19000 $43.00 18000 $31.00 21000 $34.00 18000 $28.60 18000 Age Dec. 31 1.08 1.45 2.36 1.35 1.61 1.41 0.50 0.70 1.84 3.75 3.71 2.04 Cust. Promo Aware Budget ness $2.000 94% $1,500 90% $2,000 100% $2,000 100% $1,500 90% $1,500 84% $2,000 70% $1,500 61% $1,400 88% $2,000 100% $2,000 100% $1,600 100% Cust. Sales Access Budget ibility $1,000 74% $2.000 88% $1,500 74% $3.000 88% $1.000 74% $1,800 83% $1,500 74% $1.000 88% $2.400 69% $3.000 88% $100 83% $2.300 83% Dec. Cust. Survey 45 36 22 43 22 26 38 36 21 4 7 2 Page 6 163 Foundation Market Share Fast Track F71643 Round: 5 Dec. 31, 2020 Units Sold vs Demand Chart F71643 Market Share F71643 8,000 6,000 20% 1 4,000 10% 2.000 0% 0 Andrews Baldwin Chester Low Low High Industry Unit Sales - Total Unit Demand Actual Market Share in Units High Potential Market Share in Units Low 8.117 50.2% High 5,375 Low 8,117 60.2% High 5,375 39.8% Total 13,492 100.0% Industry Unit Sales of Market Able Ace Art Total 13.1% 0.7% 13.0% 5.2% 18.9% 0.7% 11.8% 8.4% 20.8% 7.7% 4.7% 3.3% 13.1% 12.4% 15.84 11.0% 0.296 Baker Baby Brince Total 0.2% Total 13.492 Units Demanded 100.0% of Market 8.2% Able 52Ace 2.18 At 15.4% Total 6.6% Baker 4.6% Baby 6.4% Brince 17.5% Total 10.6% Cake 4.4% CRI 15.0% Total 8.4% Daze 443 Drugs 3.0 Dose 15.7% Total 6.3% 4.2% 6.1% 16.6% 11.2% 15.5% 14.7% 10.2% 15.3% 25.6% 2.8% 13.7% 16.6% 1.7% CRI Total 10.0% 5.5% 15.4% 15.5% 11.2% 16.0% 27 2 3.0% 11.1% 14.15 1.8% 10.5% 19.89 1.8% 25% 9.6% 14.0% Daze Drugs Dose Total 12.7% 0.3% TAS 0.3% 12.7% 8.1% 4.0% 2.7% 14.8% 6.78 13.0% 13.0% 6.9% 12.3% 8.1% 18.0% 1.7% 2.6% 8.8% 13.1% 8.1% 5.9% 3.5% 17.4% 19.9% 20.3% Eat Easter Eagle Total Fast FHigh Fmiddl Total 16.1% 0.8% 10.4% 27.3% 52% Easter 3. Eagle 17.5% Total 9.9% Fast 24 FHigh 6.5% Fmida 18.9% Total 4.9% 0.6% 6.1% 15.3% 0.8% 13.2% 29.2% 0.6% 4.7% 0.8% 6.1% 9.4% 2.3% 8.2% 20.0% FOUNDATIONOFAST TRACK Page 1 Foundation Perceptual Map Round: 5 Dec. 31, 2020 Fast Track F71643 Perceptual Map for All Segments Perceptual map (at end of this year) 20 18 16 14 Baze Easter 12 Size 10 Drugs Bagh 8 2 0 0 N 6 8 10 12 14 16 18 20 Name Able Ace Art Andrews Pfmn Size 6.5 13.5 10.9 9.1 10.9 9.1 Performance Baldwin Pfmn Size Revised Name 6.0 13.7 8/29/2019 Cake 9.8 10.1 3/24/2019 CRI 10.9 9.1 8/17/2020 Revised Name 6/25/2019 Baker 6/13/2020 Baby 4/17/2020 Brince Chester Pfmn Size 7.0 13.0 10.9 9.1 Revised B/21/2019 7/9/2020 Digby Ferris Pfmn 7.0 9.7 10.9 Size 129 Name Daze Drugs Dose Erie Pfmn Size 13.2 7.9 12.1 9.5 Revised Name 7/14/2020 Eat 3/22/2020 Easter 6/29/2020 Eagle Size 13.7 10.5 Revised Name 8/8/2020 Fast 1/13/2020 FHigh 7/5/2020 Fmiddl Pfmn 6.6 10.0 8.6 10.0 13.4 Revised B/17/2019 7/10/2020 1/29/2019 9.1 10.6 FOUNDATIONOFAST TRACK Page 3 Stock & Bonds Fast Track F71643 Round: 5 Dec. 31, 2020 Yield Company Andrews Baldwin Chester Digby Close $35.16 $25.63 $28.89 $28.38 $17.43 $24.27 Stock Market Summary Change MarketCap Shares Book Value (SM) $6.80 2,000,000 $70 $15.85 $7.98 2.347.657 $60 $14.99 $4.02 2,209,919 $84 $15.81 $9.47 2.756,576 $73 $15.07 $7.00 3,396,552 $59 $10.89 $4.49 3.810,194 $92 $15.06 Closing Stock Price F71643 EPS $3.96 $2.67 $2.56 $2.92 $1.27 $2.30 Dividend $1.00 S0.00 $0.50 $0.00 $0.00 S0.00 2.8% 0.0% 1.7% 0.0% 0.0% 0.0% PIE 8.9 9.6 11.3 9.0 13.7 10.6 Erie Ferris $60 $40 Andrews Baldwin Chester Digby $30 Erie $20 Ferris $10 $0 2015 2016 2017 2018 2019 2020 2021 2022 2023 Series: Face Yield Series Face Yield Company Andrews Close S&P 13.0S2021 10.0S2026 9.0S2029 Bond Market Summary Close S&P Company Digby 102.17 BB 97.43 BB 100.00 BB 103.1 BB Erie 107.87 BB 104.79 BB $2,600,000 $2,480,000 $2,000,000 12.5% 9.4% 8.8% 13.0S2021 10.0S2026 10.6S2027 11 12.0S2029 11.452030 $2,600.000 12.7% $2,480,000 10.3% $4,216.000 10.6% $6,367.000 10.9% $5,000,000 11.1% $2,000,000 10.9% AAA AAA AAA 104.06 106.36 102.44 Baldwin 13.0S2021 $2,600,000 12.7% 10.052026 $1,200,000 10.1% 9.652027 $1,500,000 9.9% 10.552028 $10,000,000 10.3% 11.952030 $7,000,000 10.8% 102.54 99.13 97.10 101.59 110.36 BBB BBB BBB BBB BBB 13.0S2021 10.082026 9.852028 10.5S2029 10.152030 13.0S2021 10.082026 9.852027 9.952028 $2,600,000 12.7% $2,480.000 10.0% $2,000,000 10.0% $4,000,000 10.3% $4,000,000 10.1% 102.63 99.57 98.41 102.29 100.00 BBB BBB BBB Ferris BBB BRB Chester 13.0S2021 $2,600,000 12.6% 10.0S2026 $1,000,000 9.3S2027 $6,368,000 9.5% 11.252028 $1,000,000 10.4% 10.452029 $13,000,000 10.0% 103.01 101.32 98.03 108.09 104.08 A A A A A $2,600,000 12.5% $1,000,000 9.5% $2,000,000 $2,200,000 9.4% 103.77 104.95 104.55 105.56 AAA Next Year's Prime Rate 7.00% FOUNDATIONOFAST TRACK Page 2 Foundation Financial Summary Fast Track F71643 Round: 5 Dec. 31, 2020 Erie Ferris Andrews Baldwin Chester Digby $7.923 $8,278 $5,681 $8,055 S4317 $8.757 Cash Flow Statement Survey CashFlows from operating activities Net Income(Loss) Adjustment for non-cash items: Depreciation Extraordinary gains/losses/writeoffs Changes in current assets and liabilities Acounts payable Inventory Accounts Receivable Net cash from operations $3.229 $0 $3,001 $0 $2,753 $0 $2,852 SO $3.443 SO $4.836 SO $468 $278 $3,906 ($1.518) $13,819 $121 $2,168 ($1,922) $9.847 ($4.840) ($10) $4,032 8909 $7,786 ($3,109) $16,493 ($2,053) $18,794 ($2,394) $22, 108 (5249) ($3,525) ($780) $9.057 ($4.400) ($7.500) ($6,200) SO ($7,240) ($7,440) Cash flows from investing activities Plant improvements(net) Cash flows from financing activities Dividends paid Sales of common stock Purchase of common stock Cash from long term debt issued Early retirement of long term debt Retirement of current debt Cash from current debt borrowing Cash from emergency loan Net cash from financing activities Net change in cash position Balance Sheet Survey Cash Accounts Receivable Inventory Total Current Assets ($2.000) $0 $0 $2,000 $0 (54.733) $0 $0 $0 $0 ($500) $4,000 $0 ($2.892) $2,000 $0 ($1,105) $0 $0 $0 $0 ($1,733) $0 $0 SO SO SO SO SO ($3,067) SO SO SO $4,000 SO $7,000 SO ($15.986) SO SO SO $3,591 SO SO SO ($1,733) SO SO ($4.733) $2,608 ($2.838) ($3,067) (54,986) $1,858 $4,686 Andrews $7,393 $12.700 $4,232 $24,325 $4,754 Baldwin $4,754 $14,401 $8,462 $27.617 ($5,006) Chester $9,216 $5,802 $5,207 $20,225 $41,300 ($ 14,613) $26,687 $13.426 Digby $13,428 $9,522 $1,163 $24,112 $9,880 Erie $9,880 $12,219 $5,169 $27.268 $3,475 Ferris $16,062 $13,571 $7,081 $36,715 Plant and equipment Accumulated Depreciation Total Fixed Assets $48.440 ($16,053) $32,387 $45.020 ($14,705) $30,315 $42.780 ($14.925) $27.855 $51,840 ($17,043) $34,597 $72,520 ($20,293) S52,227 Total Assets $56.712 $57.932 $46,911 $51,967 $81,868 S88,941 $3,337 $0 $21,663 $25.000 $6,652 $2,000 $15.080 $22.732 $4,166 $0 $7,800 $11.966 $3,332 SO $7,080 $10,412 $2.582 SO $22,300 $24.882 $7.593 SO $23,968 $31,561 Account Payable CurrentDebt Long Term Debt Total Liabilities Common Stock Retained Earnings Total Equity Total Liabilities & Owners" Equity $2,323 $29,386 $31.710 $6,707 $28.493 $35,200 $5,323 $29.622 $34.945 $48.911 $12.323 $29.232 $41,555 $15,223 $21,761 $36.984 $26,577 $30,802 $57,379 $56.712 $57.932 $51.967 $81,868 $88.941 Income Statement Survey Sales Variable Costs Labor Material. Carry) Depreciation SGA/R&D Promo, Sales, Admin) Other Fees Writeoffs,TOM,Bonuses) EBIT Interest (Short term. Long term) Taxes Profit Sharing Net Profit Andrews $77,259 $45,017 $3,229 $11.763 $2,350 $14.901 $2.462 $4,354 $162 $7.923 Baldwin $92.216 $62,123 $3,001 $12.248 $3,206 $11,636 $1,780 $3,449 $128 $6,278 Chester $70,590 $46,474 $2.753 $11.623 $0 $9,740 $852 $3,111 $116 $5,681 Digby $77 238 $48,461 $2,852 $12,513 SO $13,411 $786 $4,426 $164 $8,055 Erie $79,843 $50,825 $3.443 $12,563 $3,550 $9,261 $2.485 $2,372 $88 $4,317 Ferris S82,560 $43,518 $4,836 $11,287 $6.680 $16.241 $2.494 $4,811 $179 S8.757 FOUNDATION FAST TRACK Page 3 Foundation Production Analysis Fast Track F71643 Round: 5 Dec. 31, 2020 Production Vs. Capacity F71643 Andrews Baldwin Chester Digby Erie Ferris D 200 400 600 800 1,000 1,200 1,400 1,600 1,800 2,000 2,200 2,400 2,600 2,800 o Capacity Production 2nd Shin Over- Units Sold 1.102 600 278 Unit Inven tocy 241 Material Labor Cost Cost $9.45 $4.43 $17.72 510.45 $17.72 511 32 Contr Marg 50% 35% 34% Capacity Next Plant Round Utiliz 800 130% 420 141% 400 139% 37% 43N 100% 890 618 Auto mation Next Round 8.0 4.0 4.0 7.0 2.0 2.0 7.0 6.0 278 134 0 $8.33 $6.20 $15.47 $13.36 $17.90 $14.99 46% 28% 26% 0% 70% 78% 900 88% 480 168% 550 175 Primary Name Segment Able Low Ace High Art High Baker Low Baby High Brince High Low High Daze Low Drugs Dose High Eat Low Easter Low Eagle High Fast Low FHigh High Friddi LOW 1424 594 35% 33% Age Prim Size Revision Date Dec.31 MTBE CoordCoord Price 6/25/2019 3.7 19000 6.5 13.5 $31.00 6/13/2020 15 19000 10.9 9.1 544.00 4/17/2020 0.7 19000 10.9 9.1 $44.50 6/29/2019 3.9 19000 13.7 $31.00 3/24/2019 24 21000 10.1 $42.00 6/17/2020 1.1 23000 10.9 9.1 $45.00 6/21/2019 3.8 21000 13.0 $31.00 7/92020 1.4 21000 10.9 9.1 $44.50 7/14/2020 2.7 20000 129 $30.00 3/22/2020 1.6 21000 9.7 10.5 $43.00 6/29/2020 0.5 20000 10.9 9.1 $45.00 6/8/2020 20 18000 132 $28.60 1/13/2020 3.7 18000 7.9 12.1 $34.00 7/5/2020 1.4 17000 106 9.5 $44.50 6/17/2019 3.7 20000 13.7 $30.50 7/10/2020 1.8 18000 10.0 100 $43.00 1/29/2019 3.9 20000 13.4 $31.50 $11.00 $8.16 $18.34 $11.71 78% 100% 950 170% 300 198% High 15 591 400 39% 389 33% 24% 0% 100% 4.0 4.0 810 123 410 92% 430 99% $10.80 $7.37 $15.90 $9.45 $18.04 $11.70 $9.49 55.84 $11.51 $9.97 $16.08 $11.20 1.150 40% 29% 38% 26% 0% 12% 880 125% 500 34% 400 111% 519 4.0 3.0 9 1.340 328 875 507 0 0 $8.66 $14.09 $10.17 $8.90 $9.34 52% 46% 41% 50% 0% 90% 4.0 1,200 138% 360 90% 500 175% FOUNDATION FAST TRACK Page 4 Low Tech Segment Analysis Fast Track Round: 5 F71643 Dec. 31, 2020 Low Tech Statistics Accessibility F71643 Low Tech Total Industry Unit Demand 8.117 Actual Industry Unit Sales 8.117 Andrews Segment % of Total Industry 60.2% Baldwin Next Year's Segment Growth Rate Chester 10.0% Low Tech Customer Buying Criteria Digby Expectations Importance Erie 1. Price $15.00 - 35.00 41% Ferris Ideal Age = 3.0 29% 3. Reliability MTBF 14000-20000 21% 0% 20% 402 60% 80% 100% 4. Ideal Position Pfmn 7.3 Size 12.7 9% Perceptual Map for Low Tech Actual vs Potential Market Share Perceptual map (at end of this year) 20 2020 F71643 Low Tech 18 16 25% 2. Age 14 20% 12 15% Size 10 10% 8 8 5% 0% 2 0 0 N 4 6 8 10 12 14 16 18 20 Actual Potential Performance Top Products in Low Tech Segment Name Fast Cake Able Eat Dare Baker Fmidd Easter FHigh Drugs Baby Market Share 16% 16% 13% 13% 13% 11% 10% Units Sold to Revision Seg Date 1,307 6/17/2019 1,262 6/21/2019 1,084 6/25/2019 1,051 6/8/2020 1,028 7/14/2020 890 6/29/2019 842 1/29/2019 563 1/13/2020 66 7/10/2020 25 3/22/2020 18 3/24/2019 Stock Pfmn Size Out Coord Coord 6.6 13.7 7.0 13.0 6.5 13.5 6.8 13.2 YES 7.0 12.9 6.0 13.7 YES 6.6 13.4 YES 7.9 12.1 YES 10.0 10.0 9.7 10.5 9.8 10.1 List Price MTBF $30.50 20000 $31.00 21000 $31.00 19000 $28.60 18000 $30.00 20000 $31.00 19000 $31.50 20000 $34.00 18000 $43.00 18000 $43.00 21000 $42.00 21000 Age Dec 31 3.74 3.75 3.74 2.04 2.68 3.86 3.88 3.71 1.84 1.61 2.36 Cust. Promo Aware Budget ness $1,500 98% $2,000 100% $1,300 90% $1,600 100% $2,000 98% $1,500 89% $2,000 $2,000 100% $1,400 88% $1.500 90% $2,000 100% Cust. Sales Access Budget ibility $2.400 78% $3,000 69% $2.500 68% $2,300 65% $2.000 58% $2.000 58% SO 78% $100 65% $2.400 78% $1.000 58% $1,500 58% Dec. Cust. Survey 40 40 33 35 42 27 34 23 0 1% 0% NN FOUNDATION FASTTRACK Page 5 Foundation High Tech Segment Analysis Fast Track Round: 5 F71643 Dec. 31, 2020 High Tech Statistics Accessibility F71643 High Tech Total Industry Unit Demand 5,375 Actual Industry Unit Sales 5,375 Andrews Segment % of Total Industry 39.8% Baldwin Next Year's Segment Growth Rate 20.0% Chester High Tech Customer Buying Criteria Digby Expectations Importance Erie 1. Ideal Position Pfmn 10.9 Size 9.1 33% Ferris 2. Age Ideal Age = 0.0 29% 3. Price $25.00 - 45.00 25% 20% 60% 80% 100% 4. Reliability MTBF 17000-23000 13% Perceptual Map for High Tech Actual vs Potential Market Share Perceptual map (at end of this year) 20 2020 F71643 High Tech 18 25% 16 14 20% 12 ter 16% Size 10 10% 8 8 5% 0% 2 Andrews Ene Baldwin Chester Digby Ferris 0 0 2 4 6 8 10 12 14 16 18 20 Actual Potential Performance Top Products in High Tech Segment Units Market Sold to Revision Name Share Seg Date Brince 16% 858 6/17/2020 Ace 13% 698 6/13/2020 Baby 11% 600 3/24/2019 CRI 11% 594 7/9/2020 Drugs 11% 566 3/22/2020 Eagle 10% 518 7/5/2020 Dose 400 6/29/2020 Art 5% 278 4/17/2020 FHigh 5% 262 7/10/2020 Cake 3% 6/21/2019 Easter 133 1/13/2020 Eat 2% 99 6/8/2020 FOUNDATIONOFAST TRACK Stock Pfmn Size Out Coord Coord YES 10.9 9.1 10.9 9.1 9.8 10.1 YES 10.9 9.1 9.7 10.5 10.6 9.5 10.9 9.1 YES 10.9 9.1 YES 10.0 10.0 7.0 13.0 YES 7.9 12.1 6.8 13.2 List Price MTBF $45.00 23000 $44.00 19000 $42.00 21000 $44.50 21000 $43.00 21000 $44.50 17000 $45.00 20000 $44.50 19000 $43.00 18000 $31.00 21000 $34.00 18000 $28.60 18000 Age Dec. 31 1.08 1.45 2.36 1.35 1.61 1.41 0.50 0.70 1.84 3.75 3.71 2.04 Cust. Promo Aware Budget ness $2.000 94% $1,500 90% $2,000 100% $2,000 100% $1,500 90% $1,500 84% $2,000 70% $1,500 61% $1,400 88% $2,000 100% $2,000 100% $1,600 100% Cust. Sales Access Budget ibility $1,000 74% $2.000 88% $1,500 74% $3.000 88% $1.000 74% $1,800 83% $1,500 74% $1.000 88% $2.400 69% $3.000 88% $100 83% $2.300 83% Dec. Cust. Survey 45 36 22 43 22 26 38 36 21 4 7 2 Page 6 163 Foundation Market Share Fast Track F71643 Round: 5 Dec. 31, 2020 Units Sold vs Demand Chart F71643 Market Share F71643 8,000 6,000 20% 1 4,000 10% 2.000 0% 0 Andrews Baldwin Chester Low Low High Industry Unit Sales - Total Unit Demand Actual Market Share in Units High Potential Market Share in Units Low 8.117 50.2% High 5,375 Low 8,117 60.2% High 5,375 39.8% Total 13,492 100.0% Industry Unit Sales of Market Able Ace Art Total 13.1% 0.7% 13.0% 5.2% 18.9% 0.7% 11.8% 8.4% 20.8% 7.7% 4.7% 3.3% 13.1% 12.4% 15.84 11.0% 0.296 Baker Baby Brince Total 0.2% Total 13.492 Units Demanded 100.0% of Market 8.2% Able 52Ace 2.18 At 15.4% Total 6.6% Baker 4.6% Baby 6.4% Brince 17.5% Total 10.6% Cake 4.4% CRI 15.0% Total 8.4% Daze 443 Drugs 3.0 Dose 15.7% Total 6.3% 4.2% 6.1% 16.6% 11.2% 15.5% 14.7% 10.2% 15.3% 25.6% 2.8% 13.7% 16.6% 1.7% CRI Total 10.0% 5.5% 15.4% 15.5% 11.2% 16.0% 27 2 3.0% 11.1% 14.15 1.8% 10.5% 19.89 1.8% 25% 9.6% 14.0% Daze Drugs Dose Total 12.7% 0.3% TAS 0.3% 12.7% 8.1% 4.0% 2.7% 14.8% 6.78 13.0% 13.0% 6.9% 12.3% 8.1% 18.0% 1.7% 2.6% 8.8% 13.1% 8.1% 5.9% 3.5% 17.4% 19.9% 20.3% Eat Easter Eagle Total Fast FHigh Fmiddl Total 16.1% 0.8% 10.4% 27.3% 52% Easter 3. Eagle 17.5% Total 9.9% Fast 24 FHigh 6.5% Fmida 18.9% Total 4.9% 0.6% 6.1% 15.3% 0.8% 13.2% 29.2% 0.6% 4.7% 0.8% 6.1% 9.4% 2.3% 8.2% 20.0% FOUNDATIONOFAST TRACK Page 1 Foundation Perceptual Map Round: 5 Dec. 31, 2020 Fast Track F71643 Perceptual Map for All Segments Perceptual map (at end of this year) 20 18 16 14 Baze Easter 12 Size 10 Drugs Bagh 8 2 0 0 N 6 8 10 12 14 16 18 20 Name Able Ace Art Andrews Pfmn Size 6.5 13.5 10.9 9.1 10.9 9.1 Performance Baldwin Pfmn Size Revised Name 6.0 13.7 8/29/2019 Cake 9.8 10.1 3/24/2019 CRI 10.9 9.1 8/17/2020 Revised Name 6/25/2019 Baker 6/13/2020 Baby 4/17/2020 Brince Chester Pfmn Size 7.0 13.0 10.9 9.1 Revised B/21/2019 7/9/2020 Digby Ferris Pfmn 7.0 9.7 10.9 Size 129 Name Daze Drugs Dose Erie Pfmn Size 13.2 7.9 12.1 9.5 Revised Name 7/14/2020 Eat 3/22/2020 Easter 6/29/2020 Eagle Size 13.7 10.5 Revised Name 8/8/2020 Fast 1/13/2020 FHigh 7/5/2020 Fmiddl Pfmn 6.6 10.0 8.6 10.0 13.4 Revised B/17/2019 7/10/2020 1/29/2019 9.1 10.6 FOUNDATIONOFAST TRACK Page 3 Stock & Bonds Fast Track F71643 Round: 5 Dec. 31, 2020 Yield Company Andrews Baldwin Chester Digby Close $35.16 $25.63 $28.89 $28.38 $17.43 $24.27 Stock Market Summary Change MarketCap Shares Book Value (SM) $6.80 2,000,000 $70 $15.85 $7.98 2.347.657 $60 $14.99 $4.02 2,209,919 $84 $15.81 $9.47 2.756,576 $73 $15.07 $7.00 3,396,552 $59 $10.89 $4.49 3.810,194 $92 $15.06 Closing Stock Price F71643 EPS $3.96 $2.67 $2.56 $2.92 $1.27 $2.30 Dividend $1.00 S0.00 $0.50 $0.00 $0.00 S0.00 2.8% 0.0% 1.7% 0.0% 0.0% 0.0% PIE 8.9 9.6 11.3 9.0 13.7 10.6 Erie Ferris $60 $40 Andrews Baldwin Chester Digby $30 Erie $20 Ferris $10 $0 2015 2016 2017 2018 2019 2020 2021 2022 2023 Series: Face Yield Series Face Yield Company Andrews Close S&P 13.0S2021 10.0S2026 9.0S2029 Bond Market Summary Close S&P Company Digby 102.17 BB 97.43 BB 100.00 BB 103.1 BB Erie 107.87 BB 104.79 BB $2,600,000 $2,480,000 $2,000,000 12.5% 9.4% 8.8% 13.0S2021 10.0S2026 10.6S2027 11 12.0S2029 11.452030 $2,600.000 12.7% $2,480,000 10.3% $4,216.000 10.6% $6,367.000 10.9% $5,000,000 11.1% $2,000,000 10.9% AAA AAA AAA 104.06 106.36 102.44 Baldwin 13.0S2021 $2,600,000 12.7% 10.052026 $1,200,000 10.1% 9.652027 $1,500,000 9.9% 10.552028 $10,000,000 10.3% 11.952030 $7,000,000 10.8% 102.54 99.13 97.10 101.59 110.36 BBB BBB BBB BBB BBB 13.0S2021 10.082026 9.852028 10.5S2029 10.152030 13.0S2021 10.082026 9.852027 9.952028 $2,600,000 12.7% $2,480.000 10.0% $2,000,000 10.0% $4,000,000 10.3% $4,000,000 10.1% 102.63 99.57 98.41 102.29 100.00 BBB BBB BBB Ferris BBB BRB Chester 13.0S2021 $2,600,000 12.6% 10.0S2026 $1,000,000 9.3S2027 $6,368,000 9.5% 11.252028 $1,000,000 10.4% 10.452029 $13,000,000 10.0% 103.01 101.32 98.03 108.09 104.08 A A A A A $2,600,000 12.5% $1,000,000 9.5% $2,000,000 $2,200,000 9.4% 103.77 104.95 104.55 105.56 AAA Next Year's Prime Rate 7.00% FOUNDATIONOFAST TRACK Page 2 Foundation Financial Summary Fast Track F71643 Round: 5 Dec. 31, 2020 Erie Ferris Andrews Baldwin Chester Digby $7.923 $8,278 $5,681 $8,055 S4317 $8.757 Cash Flow Statement Survey CashFlows from operating activities Net Income(Loss) Adjustment for non-cash items: Depreciation Extraordinary gains/losses/writeoffs Changes in current assets and liabilities Acounts payable Inventory Accounts Receivable Net cash from operations $3.229 $0 $3,001 $0 $2,753 $0 $2,852 SO $3.443 SO $4.836 SO $468 $278 $3,906 ($1.518) $13,819 $121 $2,168 ($1,922) $9.847 ($4.840) ($10) $4,032 8909 $7,786 ($3,109) $16,493 ($2,053) $18,794 ($2,394) $22, 108 (5249) ($3,525) ($780) $9.057 ($4.400) ($7.500) ($6,200) SO ($7,240) ($7,440) Cash flows from investing activities Plant improvements(net) Cash flows from financing activities Dividends paid Sales of common stock Purchase of common stock Cash from long term debt issued Early retirement of long term debt Retirement of current debt Cash from current debt borrowing Cash from emergency loan Net cash from financing activities Net change in cash position Balance Sheet Survey Cash Accounts Receivable Inventory Total Current Assets ($2.000) $0 $0 $2,000 $0 (54.733) $0 $0 $0 $0 ($500) $4,000 $0 ($2.892) $2,000 $0 ($1,105) $0 $0 $0 $0 ($1,733) $0 $0 SO SO SO SO SO ($3,067) SO SO SO $4,000 SO $7,000 SO ($15.986) SO SO SO $3,591 SO SO SO ($1,733) SO SO ($4.733) $2,608 ($2.838) ($3,067) (54,986) $1,858 $4,686 Andrews $7,393 $12.700 $4,232 $24,325 $4,754 Baldwin $4,754 $14,401 $8,462 $27.617 ($5,006) Chester $9,216 $5,802 $5,207 $20,225 $41,300 ($ 14,613) $26,687 $13.426 Digby $13,428 $9,522 $1,163 $24,112 $9,880 Erie $9,880 $12,219 $5,169 $27.268 $3,475 Ferris $16,062 $13,571 $7,081 $36,715 Plant and equipment Accumulated Depreciation Total Fixed Assets $48.440 ($16,053) $32,387 $45.020 ($14,705) $30,315 $42.780 ($14.925) $27.855 $51,840 ($17,043) $34,597 $72,520 ($20,293) S52,227 Total Assets $56.712 $57.932 $46,911 $51,967 $81,868 S88,941 $3,337 $0 $21,663 $25.000 $6,652 $2,000 $15.080 $22.732 $4,166 $0 $7,800 $11.966 $3,332 SO $7,080 $10,412 $2.582 SO $22,300 $24.882 $7.593 SO $23,968 $31,561 Account Payable CurrentDebt Long Term Debt Total Liabilities Common Stock Retained Earnings Total Equity Total Liabilities & Owners" Equity $2,323 $29,386 $31.710 $6,707 $28.493 $35,200 $5,323 $29.622 $34.945 $48.911 $12.323 $29.232 $41,555 $15,223 $21,761 $36.984 $26,577 $30,802 $57,379 $56.712 $57.932 $51.967 $81,868 $88.941 Income Statement Survey Sales Variable Costs Labor Material. Carry) Depreciation SGA/R&D Promo, Sales, Admin) Other Fees Writeoffs,TOM,Bonuses) EBIT Interest (Short term. Long term) Taxes Profit Sharing Net Profit Andrews $77,259 $45,017 $3,229 $11.763 $2,350 $14.901 $2.462 $4,354 $162 $7.923 Baldwin $92.216 $62,123 $3,001 $12.248 $3,206 $11,636 $1,780 $3,449 $128 $6,278 Chester $70,590 $46,474 $2.753 $11.623 $0 $9,740 $852 $3,111 $116 $5,681 Digby $77 238 $48,461 $2,852 $12,513 SO $13,411 $786 $4,426 $164 $8,055 Erie $79,843 $50,825 $3.443 $12,563 $3,550 $9,261 $2.485 $2,372 $88 $4,317 Ferris S82,560 $43,518 $4,836 $11,287 $6.680 $16.241 $2.494 $4,811 $179 S8.757 FOUNDATION FAST TRACK Page 3