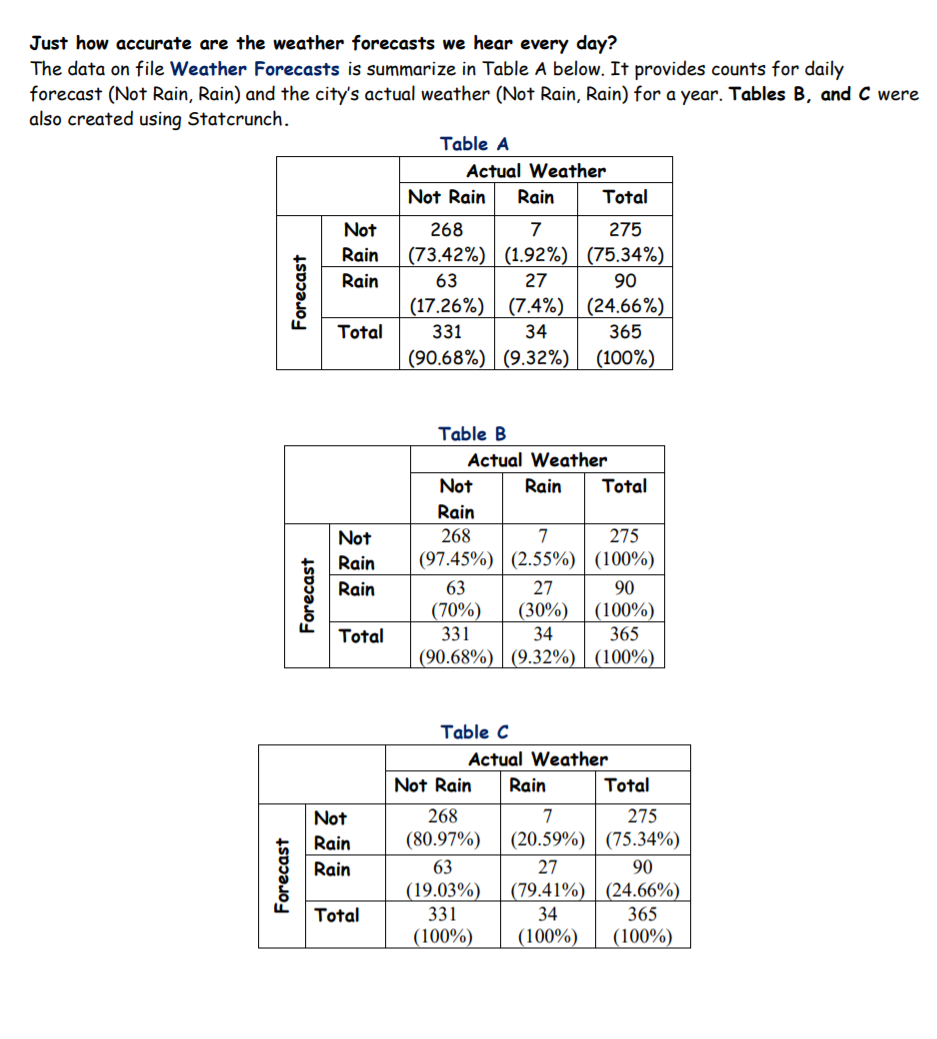
Question 1 See Weather Forecasts Tables. On what percent of days did it actually rain? O 79.41% O 24.66% O 75.34% O 32.69% O 30% O 9.32% O None of the answers given is correct. Question 2 See Weather Forecasts tables. On what percent of days was rain predicted? O 9.32% O 79.41% O 24.66% O 75.34% O 30% O None of the answers given is correct. Question 3 See Weather Forecasts tables. What percent of the time was the forecast correct? O 9.32% O 24.66% O 30% O 79.41% O 75.34% O 97.45% O 80.82% O 90.68% O None of the answers given is correct. Question 4 See Weather Forecasts tables. On days it rained, the forecast was correct _. _ of the time. O 79.41% O 9.32% O 90.68% O 97.45% O 30% O 24.66% O 75.34% O None of the answers given is correct. Question 5 See Weather Forecasts tables. On days when there was no rain, the forecast was correct _ _% of the time 0 90.68% O 9.32% O 80.97% O 24.66%% O 79.41% O 75.34% O 97.45% O None of the answers given is correct.Just how accurate are the weather forecasts we hear every day? The data on file Weather Forecasts is summarize in Table A below. It provides counts for daily forecast (Not Rain, Rain) and the city's actual weather (Not Rain, Rain) for a year. Tables B, and C were also created using Statcrunch. Table A Actual Weather Not Rain Rain Total Not 268 7 275 Rain (73.42%) (1.92%) (75.34%) Rain 63 27 90 Forecast (17.26%) (7.4%) (24.66%) Total 331 34 365 (90.68%) (9.32%) (100%) Table B Actual Weather Not Rain Total Rain Not 268 275 Rain (97.45%) (2.55%) (100%) Rain 63 27 90 Forecast (70%) (30%) (100%) Total 331 34 365 (90.68%) (9.32%) (100%) Table C Actual Weather Not Rain Rain Total Not 268 275 Rain (80.97%) (20.59%) (75.34%) Rain 63 27 90 Forecast (19.03%) (79.41%) (24.66%) Total 331 34 365 (100%) (100%) (100%)