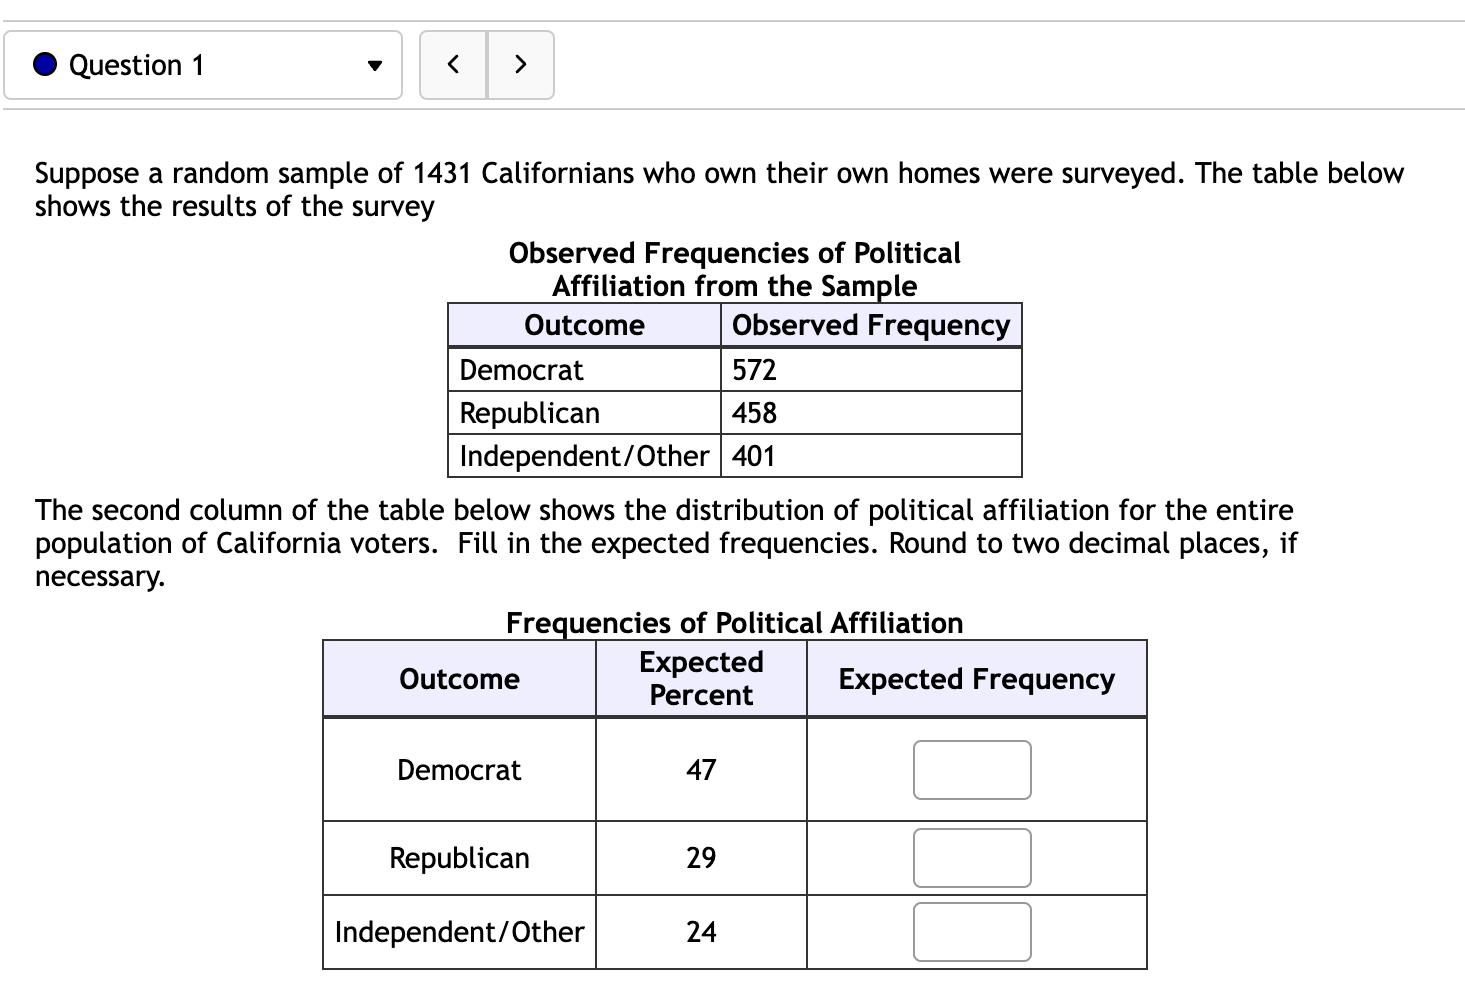
Question 1 Suppose a random sample of 1431 Californians who own their own homes were surveyed. The table below shows the results of the survey
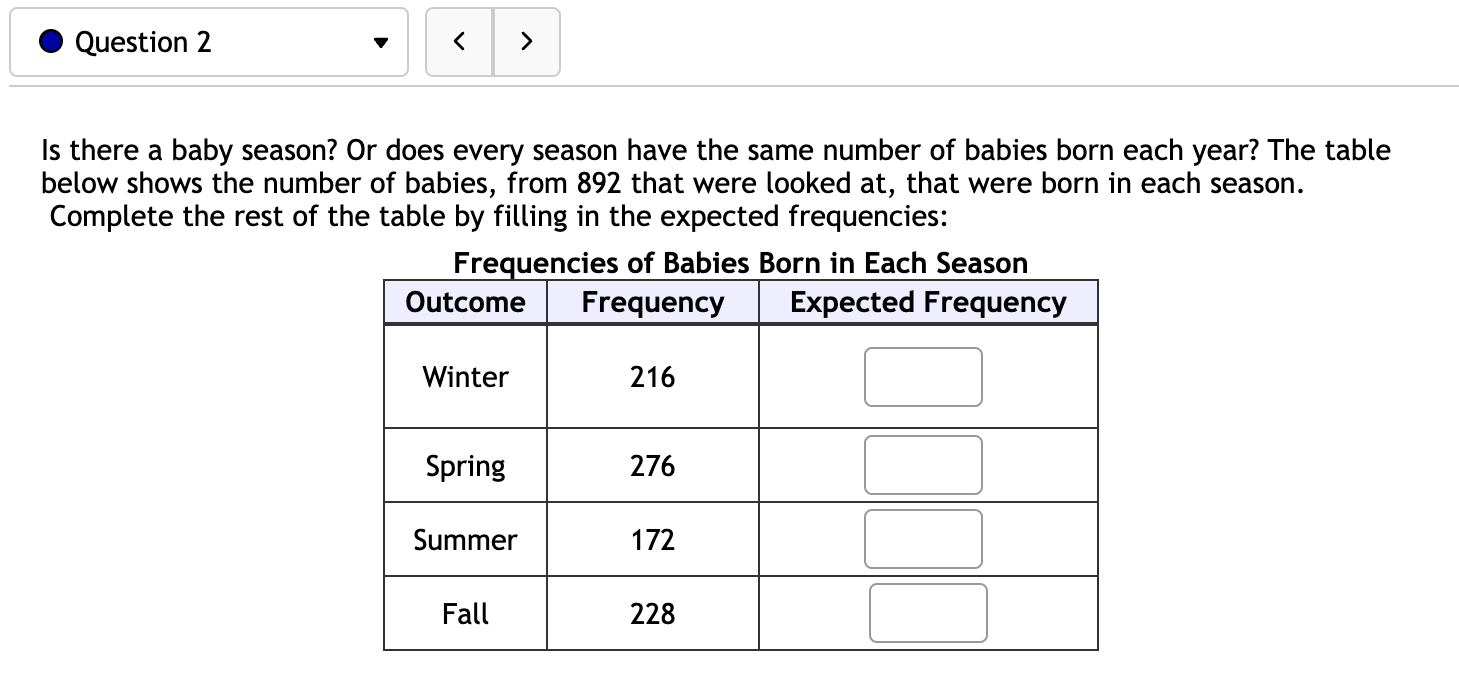
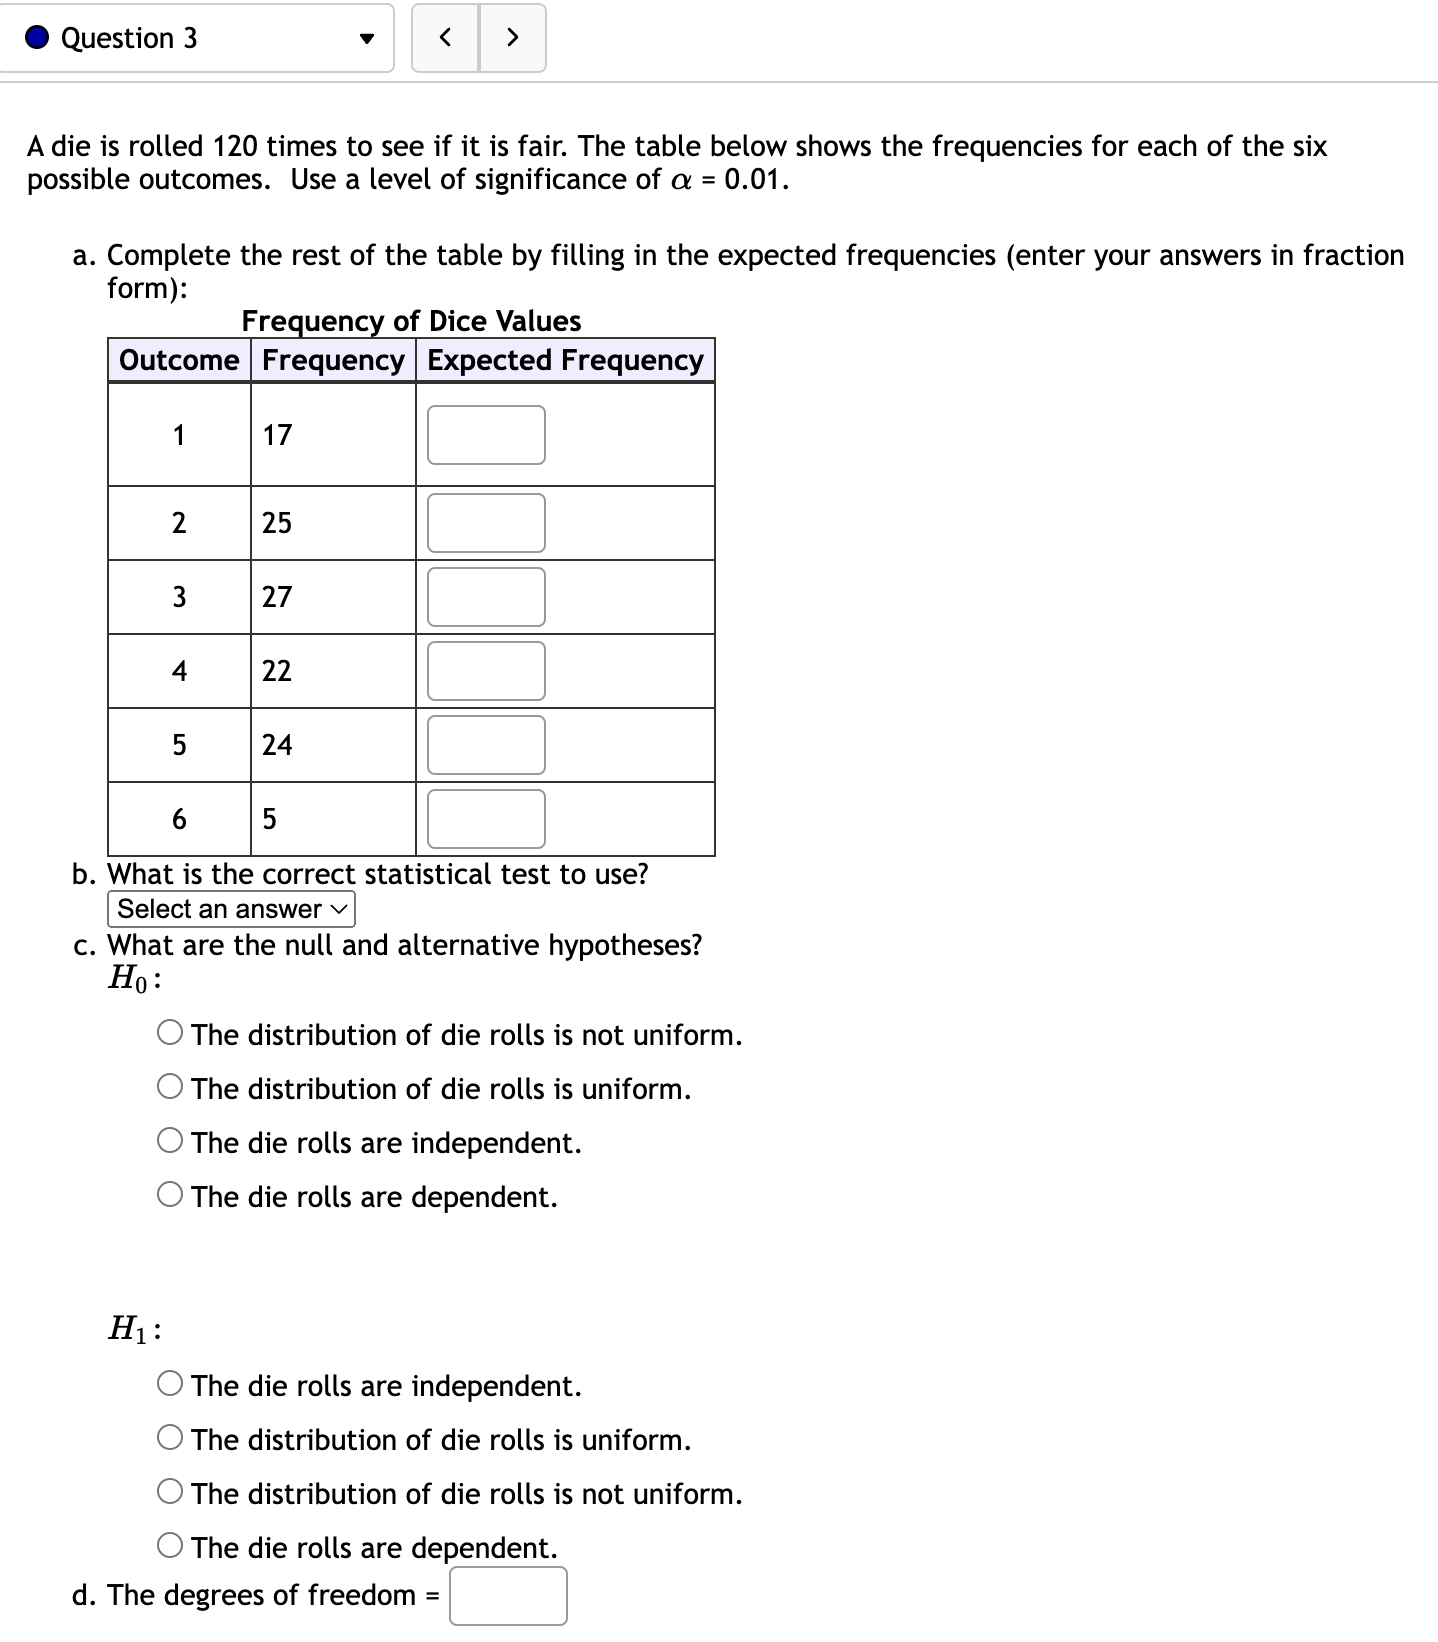
Question 1 Suppose a random sample of 1431 Californians who own their own homes were surveyed. The table below shows the results of the survey Observed Frequencies of Political Affiliation from the Sample Outcome Observed Frequency Democrat 572 Republican 458 Independent/Other | 401 The second column of the table below shows the distribution of political affiliation for the entire population of California voters. Fill in the expected frequencies. Round to two decimal places, if necessary. Frequencies of Political Affiliation Expected Outcome Percent Expected Frequency Democrat 47 Republican 29 Independent/Other 24. Question 2 Is there a baby season? Or does every season have the same number of babies born each year? The table below shows the number of babies, from 892 that were looked at, that were born in each season. Complete the rest of the table by filling in the expected frequencies: Frequencies of Babies Born in Each Season Outcome Frequency Expected Frequency Winter 216 Spring 276 Summer 172 Fall 2280 Question 3 v A die is rolled 120 times to see if it is fair. The table below shows the frequencies for each of the six possible outcomes. Use a level of significance of a = 0.01. a. Complete the rest of the table by filling in the expected frequencies (enter your answers in fraction form): b. What is the correct statistical test to use? Select an answer v c. What are the null and alternative hypotheses? H0 1 O The distribution of die rolls is not uniform. O The distribution of die rolls is uniform. O The die rolls are independent. O The die rolls are dependent. O The die rolls are independent. 0 The distribution of die rolls is uniform. O The distribution of die rolls is not uniform. O The die rolls are dependent. d. The degrees of freedom = O The die rolls are independent. O The distribution of die rolls is uniform. O The distribution of die rolls is not uniform. O The die rolls are dependent. d. The degrees of freedom = e. The test-statistic for this data = (Please show your answer to three decimal places.) f. The p-value for this sample = (Please show your answer to four decimal places.) 9- The P-Value is a h. Based on this, we should 1. Thus, the final conclusion is... Q There is insufficient evidence to conclude that the distribution of die rolls is not uniform. Q There is sufficient evidence to conclude that the distribution of die rolls is not uniform. Q There is insufficient evidence to conclude that the die rolls are dependent. Q There is sufficient evidence to conclude that the die rolls are dependent. Q There is sufficient evidence to conclude that the distribution of die rolls is uniform. . Question 4 You want to see if a card dealer is favoring one suit over another. You observe the dealer pick a card, put it back in the deck, shuffle, and then repeat the process 248 times. The results are displayed in the table below. Use an a = 0. 10 significance level. a. Complete the rest of the table by filling in the expected frequencies: Frequencies of Suits Dealt Outcome Frequency | Expected Frequency Spades 70 Hearts 42 Diamonds 65 Clubs 71 b. What is the correct statistical test to use? Select an answer v c. What are the null and alternative hypotheses? Ho The suits and cards are dependent. The distribution of suits is not uniform. The distribution of suits is uniform. The suits and cards are independent. H1 : The suits and cards are dependent. The distribution of suits is uniform. The suits and cards are independent. O The distribution of suits is not uniform. d. The degrees of freedom = e. The test-statistic for this data = (Please show your answer to three decimal places.)O The suits and cards are dependent. O The distribution of suits is uniform. O The suits and cards are independent. O The distribution of suits is not uniform. d. The degrees of freedom = e. The test-statistic for this data = (Please show your answer to three decimal places.) f. The p-value for this sample = (Please show your answer to four decimal places.) 3- The p-value is 0t h. Based on this, we should i. Thus, the final conclusion is... Q There is sufficient evidence to conclude that suits and cards are dependent. Q There is insufficient evidence to conclude that the distribution of suits is not uniform. Q There is insufficient evidence to conclude that suits and cards are dependent. Q There is sufficient evidence to conclude that the distribution of suits is not uniform. Q There is sufficient evidence to conclude that the distribution of suits is uniform. Question 5 A report just came out that stated that 21.3% of all Americans say that vanilla is their favorite ice cream, 20.3% say that chocolate is their favorite, 8.5% favor butter pecan, 9.5% favor strawberry, and the rest have other favorites. An ice cream shop owner thinks that her customers are not like the rest of America. The table below shows the results of 755 of her patrons' ice cream selections. What can be concluded at the a = 0.05 significance level? a. Complete the table by filling in the expected frequencies. Round your answers to the nearest whole number. Frequencies of Favorite Ice Cream Outcome Frequency | Expected Frequency Vanilla 171 Chocolate 154 Butter Pecan 69 Strawberry 41 Other 320 b. What is the correct statistical test to use? Select an answer v c. What are the null and alternative hypotheses? Ho: The distribution of favorite ice cream for customers at her shop is not the same as it is for Americans in general. The distribution of favorite ice cream for customers at her shop is the same as it is for Americans in general. Favorite ice cream and where the ice cream is purchased are dependent. O Favorite ice cream and where the ice cream is purchased are independent. H1 : Favorite ice cream and where the ice cream is purchased are independent. The distribution of favorite ice cream for customers at her shop is the same as it is for Americans in general. O The distribution of favorite ice cream for customers at her shop is not the same as it is for Americans in general.b. What is the correct statistical test to use? Select an answer v c. What are the null and alternative hypotheses? H0 2 O The distribution of favorite ice cream for customers at her shop is not the same as it is for Americans in general. 0 The distribution of favorite ice cream for customers at her shop is the same as it is for Americans in general. 0 Favorite ice cream and where the ice cream is purchased are dependent. O Favorite ice cream and where the ice cream is purchased are independent. O Favorite ice cream and where the ice cream is purchased are independent. 0 The distribution of favorite ice cream for customers at her shop is the same as it is for Americans in general. O The distribution of favorite ice cream for customers at her shop is not the same as it is for Americans in general. 0 Favorite ice cream and where the ice cream is purchased are dependent. d. The degrees of freedom = e. The test-statistic for this data = (Please show your answer to three decimal places.) f. The p-value for this sample = (Please show your answer to four decimal places.) g- The P-value is 0! h. Based on this, we should i. Thus, the final conclusion is... Q There is insufficient evidence to conclude that favorite ice cream and where the ice cream is purchased are dependent. Q There is sufficient evidence to conclude that the distribution of favorite ice cream for customers at her shop is the same as it is for Americans in general. 0 There is insufficient evidence to conclude that the distribution of favorite ice cream for customers at her shop is not the same as it is for Americans in general. Q There is sufficient evidence to conclude that the distribution of favorite ice cream for customers at her shop is not the same as it is for Americans in general. Q There is sufficient evidence to conclude that favorite ice cream and where the ice cream is purchased are dependent. Question 6 A recent national report states the marital status distribution of the male population age 18 or older is as follows: Never Married (32.6%), Married (53.8%), Widowed (2.8%), Divorced (10.8%). The table below shows the results of a random sample of 1836 adult men from California. Test the claim that the distribution from California is as expected at the a = 0.10 significance level. a. Complete the table by filling in the expected frequencies. Round to the nearest whole number: Frequencies of Marital Status Outcome Frequency | Expected Frequency Never Married |598 Married 990 Widowed 31 Divorced 217 b. What is the correct statistical test to use? Select an answer v c. What are the null and alternative hypotheses? Ho : O Marital status and residency are independent. The distribution of marital status in California is not the same as it is nationally. O Marital status and residency are dependent. The distribution of marital status in California is the same as it is nationally. H1 : O Marital status and residency are independent. The distribution of marital status in California is not the same as it is nationally. The distribution of marital status in California is the same as it is nationally. O Marital status and residency are dependent. d. The degrees of freedom = e. The test-statistic for this data = (Please show your answer to three decimal places.)O The distribution of marital status in California is not the same as it is nationally. O Marital status and residency are dependent. O The distribution of marital status in California is the same as it is nationally. O Marital status and residency are independent. O The distribution of marital status in California is not the same as it is nationally. O The distribution of marital status in California is the same as it is nationally. 0 Marital status and residency are dependent. d. The degrees of freedom = e. The test-statistic for this data = (Please show your answer to three decimal places.) f. The p-value for this sample = (Please show your answer to four decimal places.) 2- The p-value is a h. Based on this, we should i. Thus, the final conclusion is... Q There is insufficient evidence to conclude that the distribution of marital status in California is not the same as it is nationally. Q There is sufficient evidence to conclude that the distribution of marital status in California is not the same as it is nationally. Q There is insufficient evidence to conclude that marital status and residency are dependent. Q There is sufficient evidence to conclude that the distribution of marital status in California is the same as it is nationally. Q There is sufficient evidence to conclude that marital status and residency are dependent. Question 7 You are conducting a Goodness of Fit Chi-Squared hypothesis test (a = 0.05) for the claim that all 5 categories are equally likely to be selected. Complete the table. Category Observed Expected Frequency Frequency ((0-E)^2/E) A 13 P 19 C 9 D 5 E 21 Round Expected values accurate to exactly 2 decimal places. Retain unrounded numbers for future calculations. Round the ((0-E) ^2/E) values to 3 decimals. What is the chi-square test-statistic for this data? (Round answer to 3 decimal places, and remember to use the unrounded Pearson residuals in your calculations.) X' = What are the degrees of freedom for this test? d.f. = What is the p-value for this sample? (Round answer to 3 decimal places.) p-value = The p-value is... O less than (or equal to) a O greater than a This test statistic leads to a decision to... O reject the null O fail to reject the null As such, the final conclusion is that...0 Question 8 v You are conducting a multinomial Goodness of Fit hypothesis test for the claim that the 4 categories occur with the following frequencies: Ho :pA = 0.1; p3 = 0.1; p0 = 0.5; pp 2 0.3 Com- lete the table. Re-ort all answers accurate to three decimal places. Category Observed Expected Residual Frequency Frequency What is the chi-square test-statistic for this data? X2 = For significance level alpha 0.01, what is the chi-square Critical Value? Critical Value = What would be the conclusion of this hypothesis test? O Fail to reject the Null Hypothesis O Reject the Null Hypothesis 0 Question 9 v You are conducting a multinomial hypothesis test for the claim that all 5 categories are equally likely to be selected. Com -lete the table. observed 32233: Frequency Residual What is the chi-square test-statistic for this data? 2 X = [I Report all answers accurate to three decimal places. Question 10 You are conducting a multinomial hypothesis test (a = 0.05) for the claim that all 5 categories are equally likely to be selected. Complete the table. Category Observed Expected Frequency Frequency A 8 B 19 C 19 D 25 E 13 Report all answers accurate to three decimal places. But retain unrounded numbers for future calculations. What is the chi-square test-statistic for this data? (Report answer accurate to three decimal places, and remember to use the unrounded Pearson residuals in your calculations.) What are the degrees of freedom for this test? d.f. = What is the p-value for this sample? (Report answer accurate to four decimal places.) p-value = The p-value is... O less than (or equal to) a O greater than a This test statistic leads to a decision to... O reject the null O accept the null O fail to reject the null
Step by Step Solution
There are 3 Steps involved in it
Step: 1
Get Instant Access to Expert-Tailored Solutions
See step-by-step solutions with expert insights and AI powered tools for academic success
Step: 2
Step: 3
Ace Your Homework with AI
Get the answers you need in no time with our AI-driven, step-by-step assistance