Question
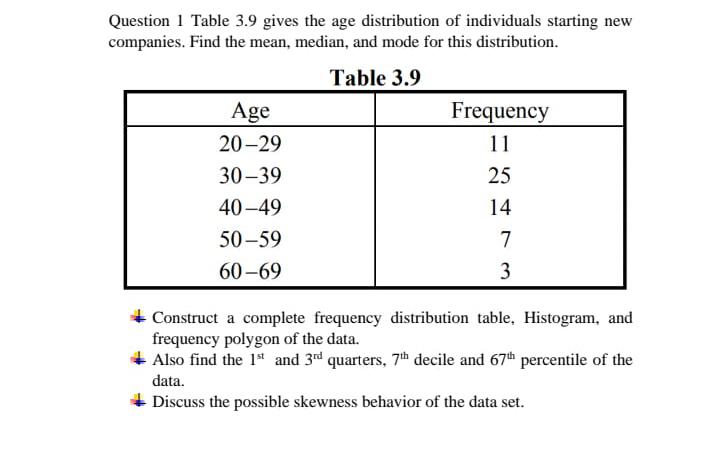
Question 1 Table 3.9 gives the age distribution of individuals starting new companies. Find the mean, median, and mode for this distribution. Table 3.9

Question 1 Table 3.9 gives the age distribution of individuals starting new companies. Find the mean, median, and mode for this distribution. Table 3.9 Age Frequency 20-29 11 30-39 25 40-49 14 50-59 7 60-69 3 Construct a complete frequency distribution table, Histogram, and frequency polygon of the data. Also find the 1st and 3rd quarters, 7th decile and 67th percentile of the data. + Discuss the possible skewness behavior of the data set.
Step by Step Solution
3.54 Rating (151 Votes )
There are 3 Steps involved in it
Step: 1
the mean for this distribution is Sum of Midpoint FrequencySum of Frequency 24511 34525 44514 5457 6...
Get Instant Access to Expert-Tailored Solutions
See step-by-step solutions with expert insights and AI powered tools for academic success
Step: 2

Step: 3

Ace Your Homework with AI
Get the answers you need in no time with our AI-driven, step-by-step assistance
Get StartedRecommended Textbook for
Elementary Statistics In Social Research Essentials
Authors: Jack A. Levin, James Alan Fox
3rd Edition
0205638007, 978-0205638000
Students also viewed these Mathematics questions
Question
Answered: 1 week ago
Question
Answered: 1 week ago
Question
Answered: 1 week ago
Question
Answered: 1 week ago
Question
Answered: 1 week ago
Question
Answered: 1 week ago
Question
Answered: 1 week ago
Question
Answered: 1 week ago
Question
Answered: 1 week ago
Question
Answered: 1 week ago
Question
Answered: 1 week ago
Question
Answered: 1 week ago
Question
Answered: 1 week ago
Question
Answered: 1 week ago
Question
Answered: 1 week ago
Question
Answered: 1 week ago
Question
Answered: 1 week ago
Question
Answered: 1 week ago
Question
Answered: 1 week ago
Question
Answered: 1 week ago
Question
Answered: 1 week ago
Question
Answered: 1 week ago
View Answer in SolutionInn App


