

Answered step by step
Verified Expert Solution
Question
1 Approved Answer
Question 1: Testing the CAPM. Sheet Stock_returns contains the monthly returns of 600 large European stocks between 2005 and 2014. Obtain the market factor by
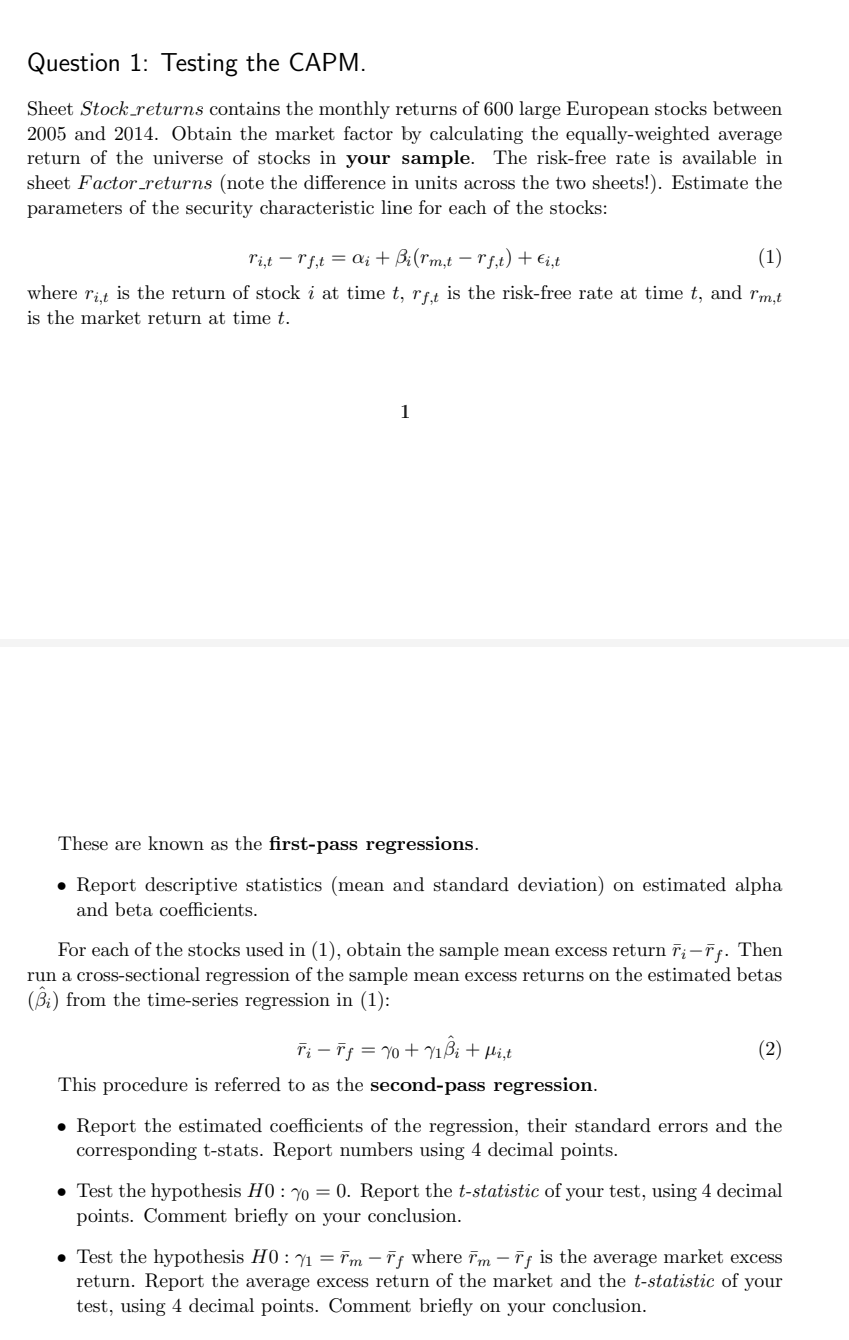
Question 1: Testing the CAPM. Sheet Stock_returns contains the monthly returns of 600 large European stocks between 2005 and 2014. Obtain the market factor by calculating the equally-weighted average return of the universe of stocks in your sample. The risk-free rate is available in sheet Factor returns (note the difference in units across the two sheets!). Estimate the parameters of the security characteristic line for each of the stocks: l'int - rf,t = Qi + Birm,t - rf,t) + Eint (1) where ri,t is the return of stock i at time t, rf,t is the risk-free rate at time t, and I'm,t is the market return at time t. 1 These are known as the first-pass regressions. Report descriptive statistics (mean and standard deviation) on estimated alpha and beta coefficients. For each of the stocks used in (1), obtain the sample mean excess return i; -rf. Then run a cross-sectional regression of the sample mean excess returns on the estimated betas (i) from the time-series regression in (1): (2) Ti - ig = 70 + r1i + Hint This procedure is referred to as the second-pass regression. Report the estimated coefficients of the regression, their standard errors and the corresponding t-stats. Report numbers using 4 decimal points. Test the hypothesis H0 : 7 = 0. Report the t-statistic of your test, using 4 decimal points. Comment briefly on your conclusion. Test the hypothesis H0:71 = rm -rf where im-rf is the average market excess return. Report the average excess return of the market and the t-statistic of your test, using 4 decimal points. Comment briefly on your conclusion. Question 1: Testing the CAPM. Sheet Stock_returns contains the monthly returns of 600 large European stocks between 2005 and 2014. Obtain the market factor by calculating the equally-weighted average return of the universe of stocks in your sample. The risk-free rate is available in sheet Factor returns (note the difference in units across the two sheets!). Estimate the parameters of the security characteristic line for each of the stocks: l'int - rf,t = Qi + Birm,t - rf,t) + Eint (1) where ri,t is the return of stock i at time t, rf,t is the risk-free rate at time t, and I'm,t is the market return at time t. 1 These are known as the first-pass regressions. Report descriptive statistics (mean and standard deviation) on estimated alpha and beta coefficients. For each of the stocks used in (1), obtain the sample mean excess return i; -rf. Then run a cross-sectional regression of the sample mean excess returns on the estimated betas (i) from the time-series regression in (1): (2) Ti - ig = 70 + r1i + Hint This procedure is referred to as the second-pass regression. Report the estimated coefficients of the regression, their standard errors and the corresponding t-stats. Report numbers using 4 decimal points. Test the hypothesis H0 : 7 = 0. Report the t-statistic of your test, using 4 decimal points. Comment briefly on your conclusion. Test the hypothesis H0:71 = rm -rf where im-rf is the average market excess return. Report the average excess return of the market and the t-statistic of your test, using 4 decimal points. Comment briefly on your conclusion
Step by Step Solution
There are 3 Steps involved in it
Step: 1

Get Instant Access to Expert-Tailored Solutions
See step-by-step solutions with expert insights and AI powered tools for academic success
Step: 2

Step: 3
Ace Your Homework with AI
Get the answers you need in no time with our AI-driven, step-by-step assistance
Get Started
Ethical Reflections On The Financial Crisis 2007/2008 Making Use Of Smith Musgrave And Rajan
Authors: Wilfried Ver Eecke
1st Edition
3642350909,3642350917