question 1: The accompanying data represent the muzzle velocity (in meters per second) of rounds fired from a 155-mm gun. 793.8 793.1 792.4 794.0 791.4
question 1:
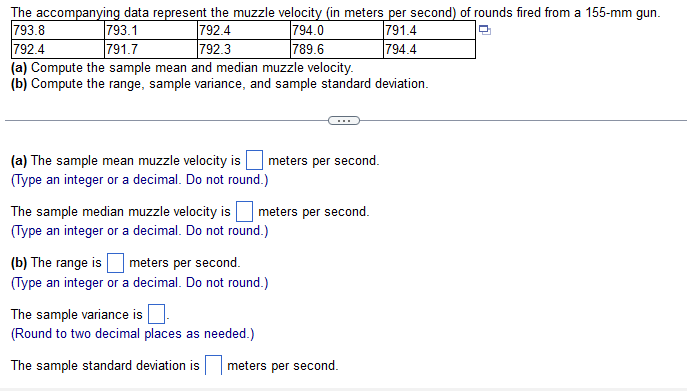
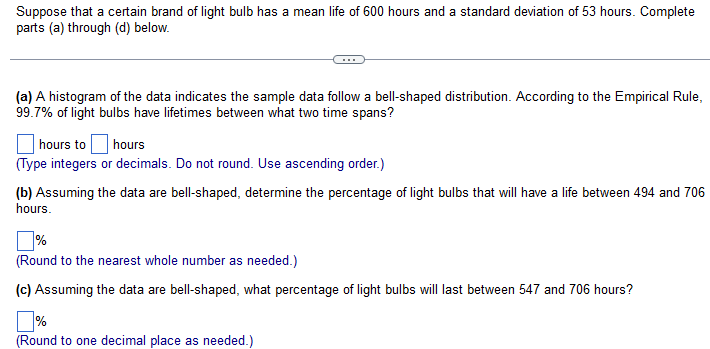
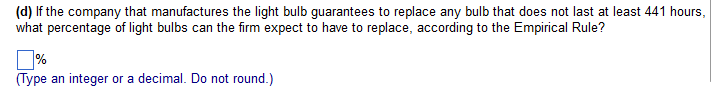
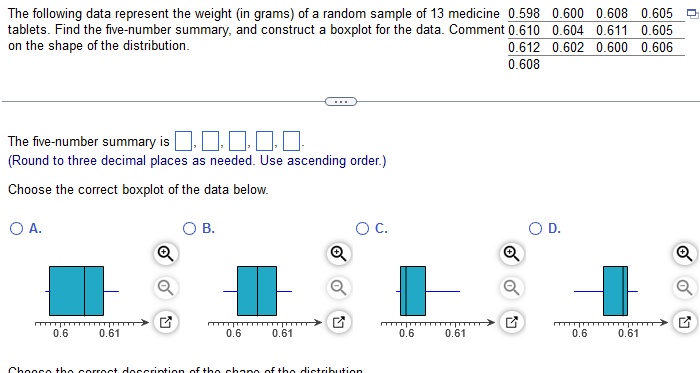
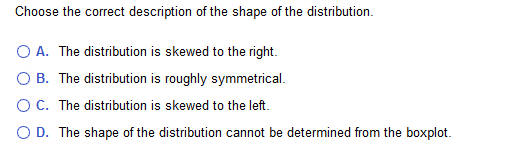
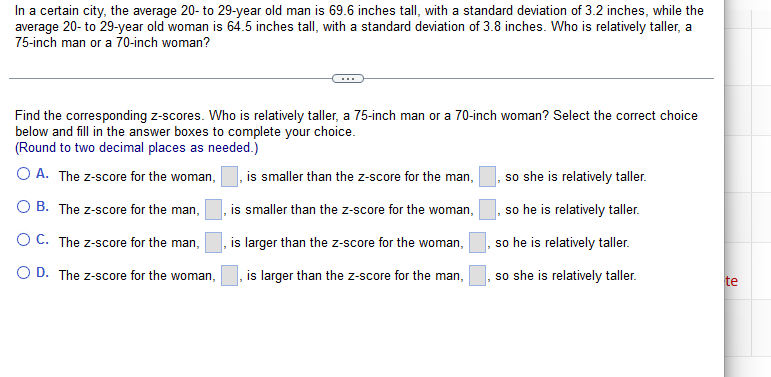
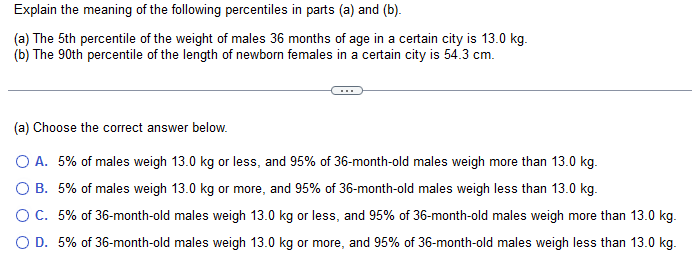
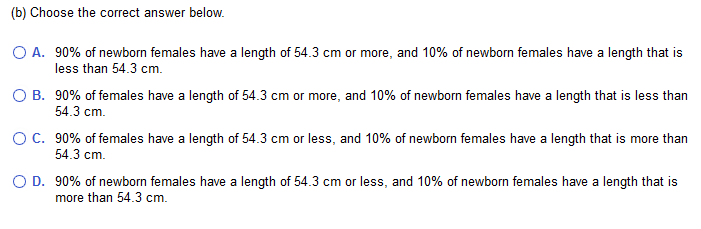
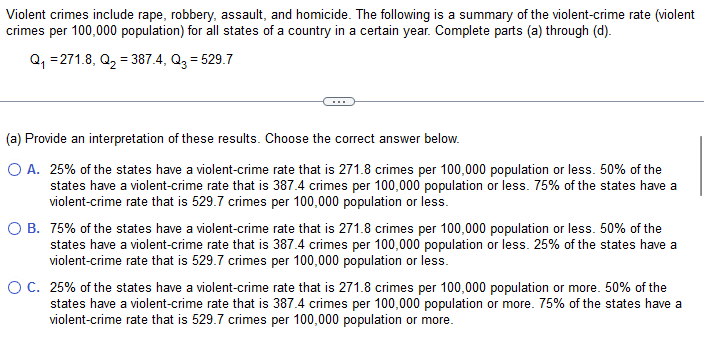
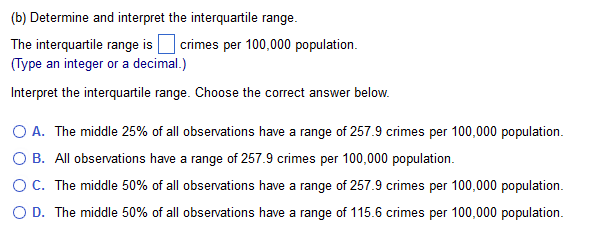
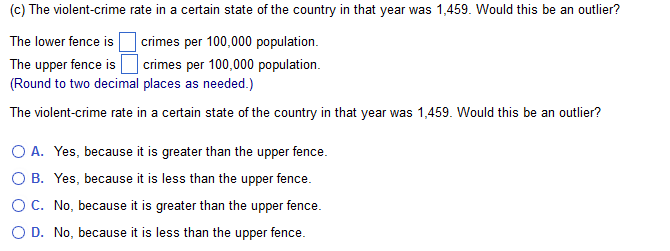
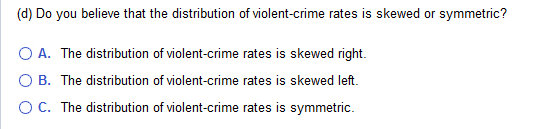
The accompanying data represent the muzzle velocity (in meters per second) of rounds fired from a 155-mm gun. 793.8 793.1 792.4 794.0 791.4 792.4 791.7 792.3 789.6 794.4 (a) Compute the sample mean and median muzzle velocity. (b) Compute the range, sample variance, and sample standard deviation. (a) The sample mean muzzle velocity is meters per second. (Type an integer or a decimal. Do not round.) The sample median muzzle velocity is meters per second. (Type an integer or a decimal. Do not round.) (b) The range is meters per second. (Type an integer or a decimal. Do not round.) The sample variance is (Round to two decimal places as needed.) The sample standard deviation is meters per second.Suppose that a certain brand of light bulb has a mean life of 600 hours and a standard deviation of 53 hours. Complete parts (a) through (d) below. (a) A histogram of the data indicates the sample data follow a bell-shaped distribution. According to the Empirical Rule, 99.7% of light bulbs have lifetimes between what two time spans? hours to hours (Type integers or decimals. Do not round. Use ascending order.) (b) Assuming the data are bell-shaped, determine the percentage of light bulbs that will have a life between 494 and 706 hours. (Round to the nearest whole number as needed.) (c) Assuming the data are bell-shaped, what percentage of light bulbs will last between 547 and 706 hours? (Round to one decimal place as needed.)(d) If the company that manufactures the light bulb guarantees to replace any bulb that does not last at least 441 hours, what percentage of light bulbs can the firm expect to have to replace, according to the Empirical Rule? 1% (Type an integer or a decimal. Do not round.)The following data represent the weight (in grams) of a random sample of 13 medicine 0.598 0.600 0.608 0.605 tablets. Find the five-number summary, and construct a boxplot for the data. Comment 0.610 0.604 0.611 0.605 on the shape of the distribution. 0.612 0.602 0.600 0.606 0.608 The five-number summary is. . . 0. 0 (Round to three decimal places as needed. Use ascending order.) Choose the correct boxplot of the data below. O A. OB. O C. O D. O 0.6 0.61 0.6 0.61 0.6 0.61 0.6 0.61Choose the correct description of the shape of the distribution. O A. The distribution is skewed to the right. O B. The distribution is roughly symmetrical. O C. The distribution is skewed to the left. O D. The shape of the distribution cannot be determined from the boxplot.In a certain city, the average 20- to 29-year old man is 69.6 inches tall, with a standard deviation of 3.2 inches, while the average 20- to 29-year old woman is 64.5 inches tall, with a standard deviation of 3.8 inches. Who is relatively taller, a 75-inch man or a 70-inch woman? Find the corresponding z-scores. Who is relatively taller, a 75-inch man or a 70-inch woman? Select the correct choice below and fill in the answer boxes to complete your choice. (Round to two decimal places as needed.) O A. The z-score for the woman, is smaller than the z-score for the man, so she is relatively taller. O B. The z-score for the man, is smaller than the z-score for the woman, so he is relatively taller. O C. The z-score for the man, is larger than the z-score for the woman, so he is relatively taller. O D. The z-score for the woman, is larger than the z-score for the man, so she is relatively taller. teExplain the meaning of the following percentiles in parts (a) and (b). (a) The 5th percentile of the weight of males 36 months of age in a certain city is 13.0 kg. (b) The 90th percentile of the length of newborn females in a certain city is 54.3 cm. (a) Choose the correct answer below. O A. 5% of males weigh 13.0 kg or less, and 95% of 36-month-old males weigh more than 13.0 kg. O B. 5% of males weigh 13.0 kg or more, and 95% of 36-month-old males weigh less than 13.0 kg. O C. 5% of 36-month-old males weigh 13.0 kg or less, and 95% of 36-month-old males weigh more than 13.0 kg. O D. 5% of 36-month-old males weigh 13.0 kg or more, and 95% of 36-month-old males weigh less than 13.0 kg.(b) Choose the correct answer below. O A. 90% of newborn females have a length of 54.3 cm or more, and 10% of newborn females have a length that is less than 54.3 cm. O B. 90% of females have a length of 54.3 cm or more, and 10% of newborn females have a length that is less than 54.3 cm. O C. 90% of females have a length of 54.3 cm or less, and 10% of newborn females have a length that is more than 54.3 cm. O D. 90% of newborn females have a length of 54.3 cm or less, and 10% of newborn females have a length that is more than 54.3 cm.Violent crimes include rape, robbery, assault, and homicide. The following is a summary of the violent-crime rate (violent crimes per 100,000 population) for all states of a country in a certain year. Complete parts (a) through (d). Q, =271.8, Q2 = 387.4, Q, = 529.7 (a) Provide an interpretation of these results. Choose the correct answer below. O A. 25% of the states have a violent-crime rate that is 271.8 crimes per 100,000 population or less. 50% of the states have a violent-crime rate that is 387.4 crimes per 100,000 population or less. 75% of the states have a violent-crime rate that is 529.7 crimes per 100,000 population or less. O B. 75% of the states have a violent-crime rate that is 271.8 crimes per 100,000 population or less. 50% of the states have a violent-crime rate that is 387.4 crimes per 100,000 population or less. 25% of the states have a violent-crime rate that is 529.7 crimes per 100,000 population or less. O C. 25% of the states have a violent-crime rate that is 271.8 crimes per 100,000 population or more. 50% of the states have a violent-crime rate that is 387.4 crimes per 100,000 population or more. 75% of the states have a violent-crime rate that is 529.7 crimes per 100,000 population or more.(b) Determine and interpret the interquartile range. The interquartile range is crimes per 100,000 population. (Type an integer or a decimal.) Interpret the interquartile range. Choose the correct answer below. O A. The middle 25% of all observations have a range of 257.9 crimes per 100,000 population. O B. All observations have a range of 257.9 crimes per 100,000 population. O C. The middle 50% of all observations have a range of 257.9 crimes per 100,000 population. O D. The middle 50% of all observations have a range of 115.6 crimes per 100,000 population.(c) The violent-crime rate in a certain state of the country in that year was 1,459. Would this be an outlier? The lower fence is crimes per 100,000 population. The upper fence is crimes per 100,000 population. (Round to two decimal places as needed.) The violent-crime rate in a certain state of the country in that year was 1,459. Would this be an outlier? O A. Yes, because it is greater than the upper fence. O B. Yes, because it is less than the upper fence. O C. No, because it is greater than the upper fence. O D. No, because it is less than the upper fence.(d) Do you believe that the distribution of violent-crime rates is skewed or symmetric? O A. The distribution of violent-crime rates is skewed right. O B. The distribution of violent-crime rates is skewed left. O C. The distribution of violent-crime rates is symmetric
Step by Step Solution
There are 3 Steps involved in it
Step: 1
Get Instant Access to Expert-Tailored Solutions
See step-by-step solutions with expert insights and AI powered tools for academic success
Step: 2
Step: 3
Ace Your Homework with AI
Get the answers you need in no time with our AI-driven, step-by-step assistance