

Answered step by step
Verified Expert Solution
Question
1 Approved Answer
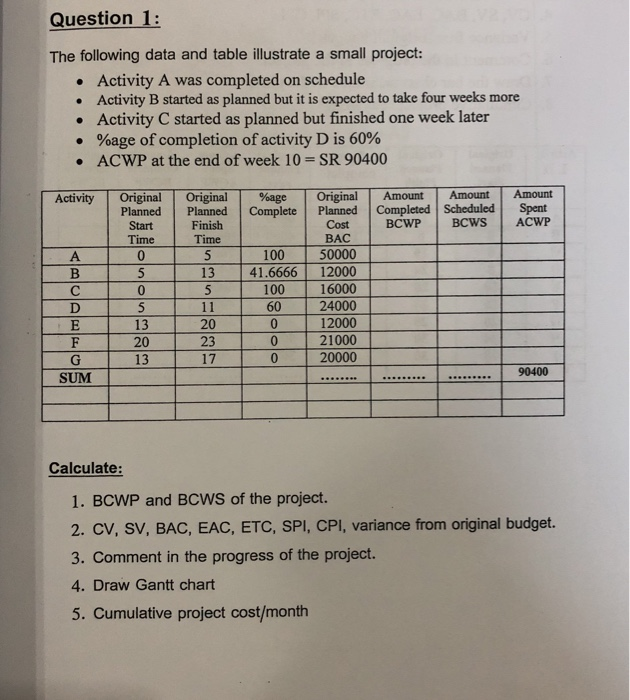
Question 1: The following data and table illustrate a small project: Activity A was completed on schedule Activity B started as planned but it is
Step by Step Solution
There are 3 Steps involved in it
Step: 1

Get Instant Access to Expert-Tailored Solutions
See step-by-step solutions with expert insights and AI powered tools for academic success
Step: 2

Step: 3
Ace Your Homework with AI
Get the answers you need in no time with our AI-driven, step-by-step assistance
Get Started
Economic Influences On The Development Of Accounting In Firms
Authors: George J. Staubus
1st Edition
0367721325, 9780367721329