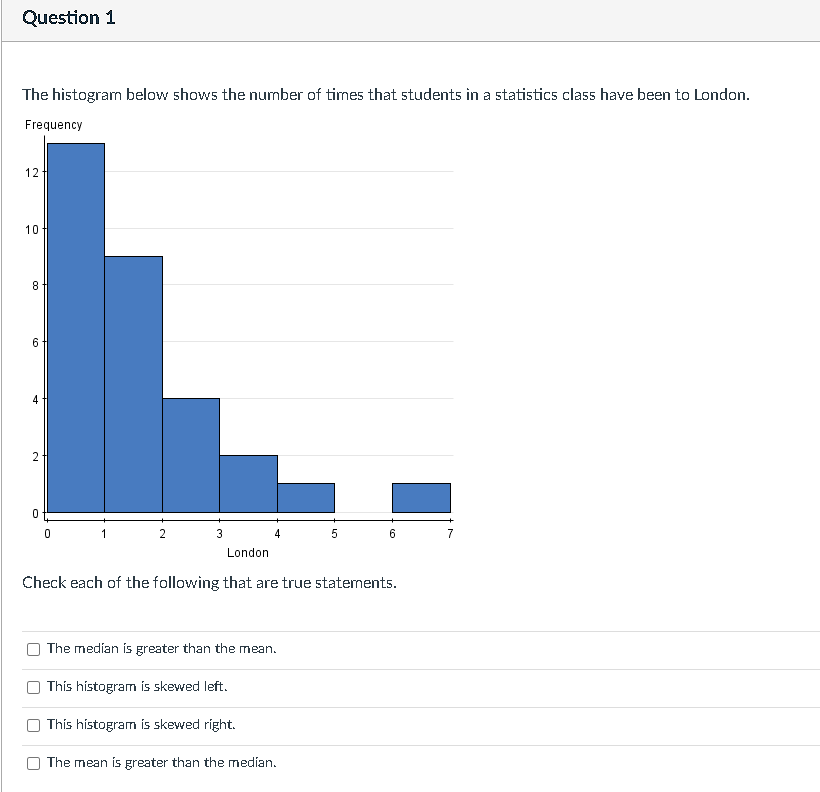
Question 1 The histogram below shows the number of times that students in a statistics class have been to London. Frequency 12 1E] LOl'Ile'I Check
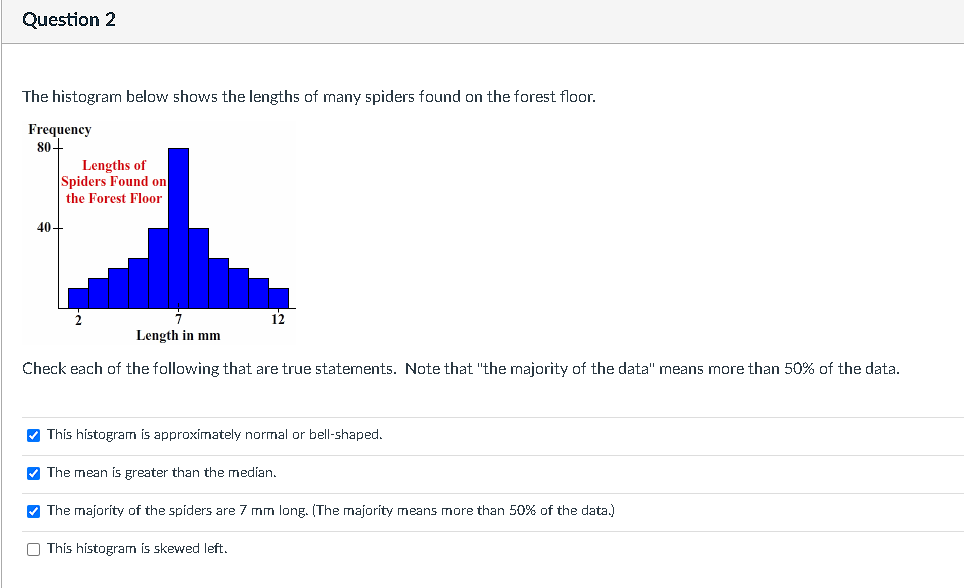
Question 1 The histogram below shows the number of times that students in a statistics class have been to London. Frequency 12 1E] LOl'Ile'I Check each of the following that are true statements. |:| The median is greater than the mean. |:| This histogram is skewed left. |:| This histogram is skewed right. |:| The mean is greater than the median. Question 2 The histogram below shows the lengths of many spiders found on the forest floor. Frequency Lengths {Il' Spldt'l" Found on the Fort-5t Floor 7 Length in min 12 Check each of the following that are true statements. Note that "the majority of the data" means more than 50% of the data. This histogram is approximately normal or bell-shaped. The mean is greater than the median. The majority of the spiders are 7 mm long. [The majority means more than 50% of the data.) |:| This histogram is skewed left. Question 3 1 pts For which one of the following distributions will the median be a better measure of center than the mean? {:- Repeated weight measurements of the same 1.6sounce bag of Peanut M&Ms by students in a large chemistry class using a balance scale. [i] Salary data for players in the National Basketball Association (NBA) where most of the players earn the league minimum and a few superstars earn very high salaries in comparison. {:- Exam scores with a central peak around an average test score and a few students scoring lower than the average and a few scoring higher. -:_':- Height data from a large random sample of men. Question 4 1 pts A retail store had total sales of $345, $892, $227, $305, and $243 last week. Which measure of center would make the store's sales look the most protable and why? {:3- Median because the data is skewed and this is more accurate. Median. because the data is skewed -:':':- Mean. because the data is skewed right the mean will be higher than the median -:j'j:- Mean. because the data is normal -:j'j:- Mean. because this is always the best measure of center Question 5 1 pts Acollege statistics class conducted a survey. They randomly selected 50 students to estimate how much money they typically spend each week eating out. They determined that the mean amount spent on fastfood each week is $42.52 and the median is $37. Later they realized that a value entered as $2 should have been $20. They recalculate the mean and the median. Which statement is true? "2': Both the mean and median will not change -:':j:- The mean will increase. the median will not change ":3 Unable to tell with the information given -":j:- The median will increase. the mean will not change -:':j:- Both the mean and median will increase
Step by Step Solution
There are 3 Steps involved in it
Step: 1
Get Instant Access to Expert-Tailored Solutions
See step-by-step solutions with expert insights and AI powered tools for academic success
Step: 2
Step: 3
Ace Your Homework with AI
Get the answers you need in no time with our AI-driven, step-by-step assistance