Question 1 You want to know if your niece has a learning disability, so you take her to get her I1Q tested. The known population
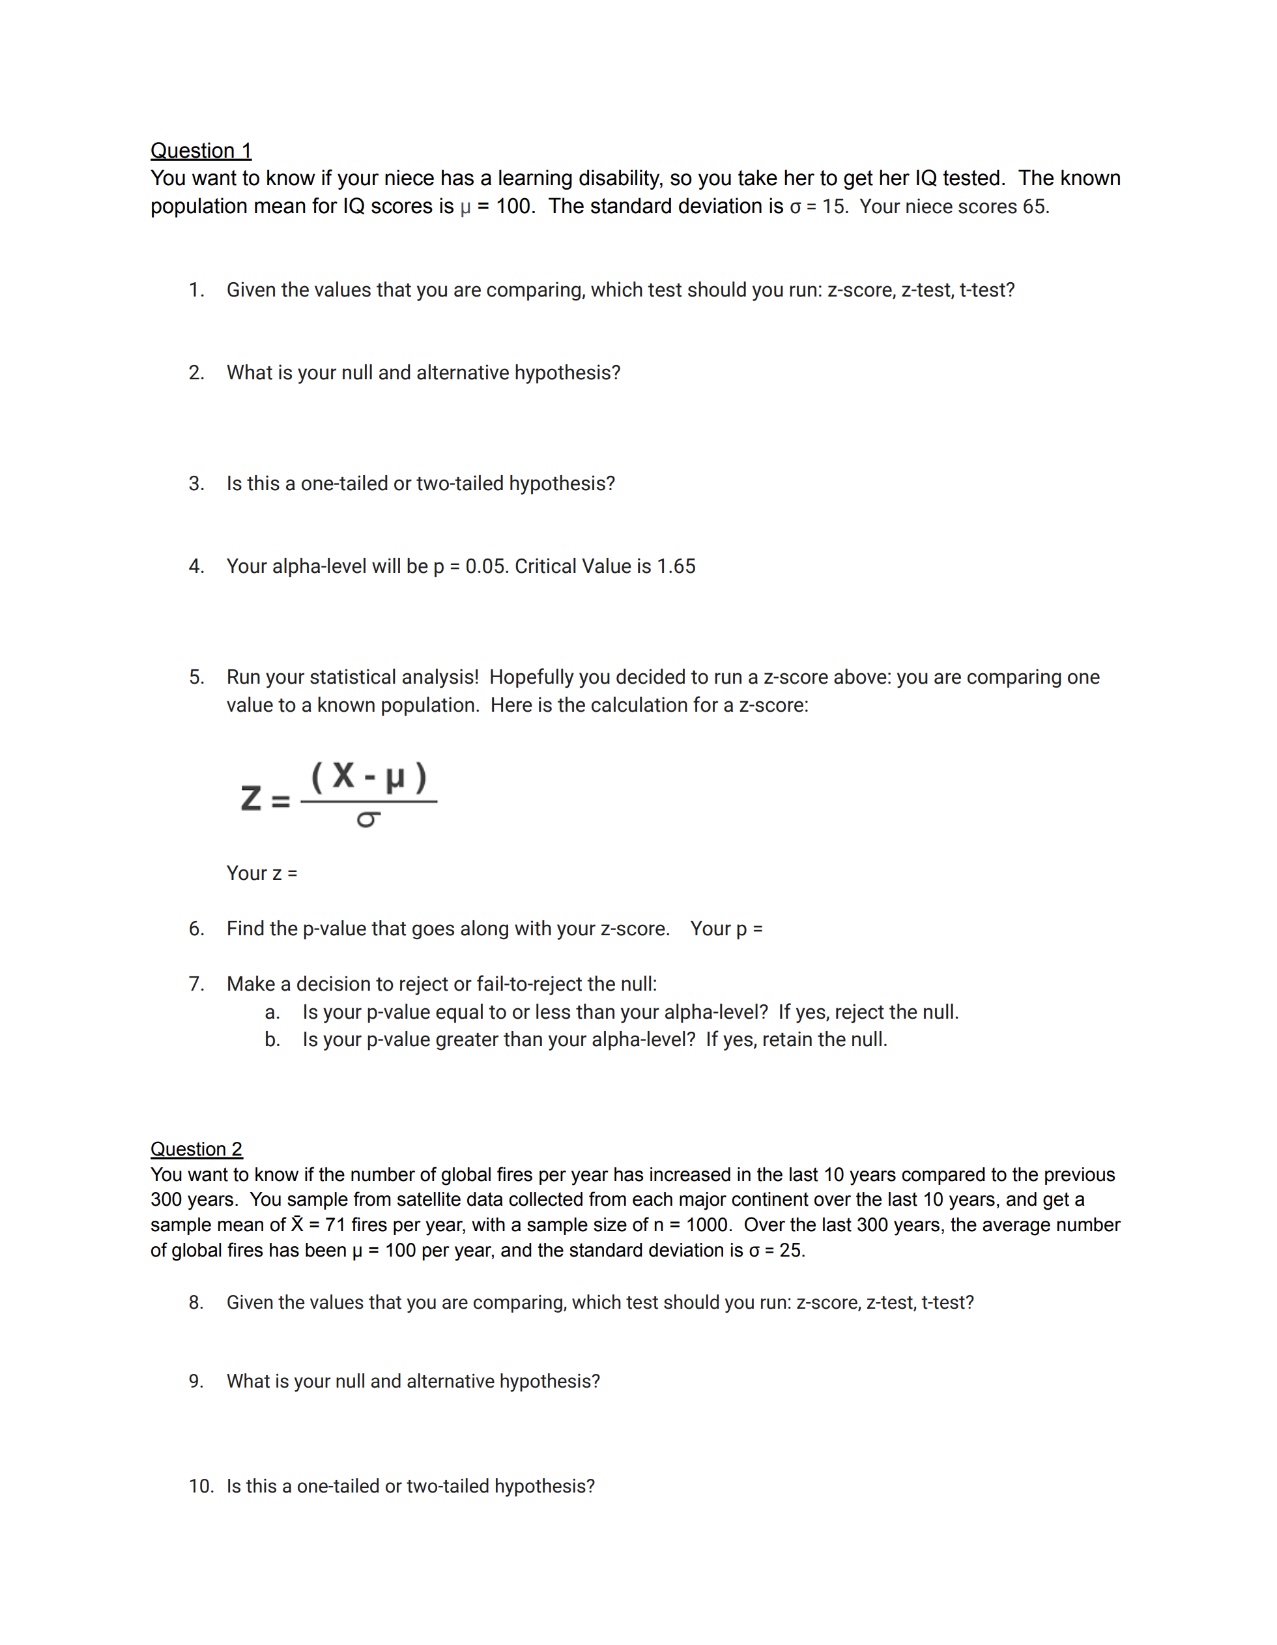
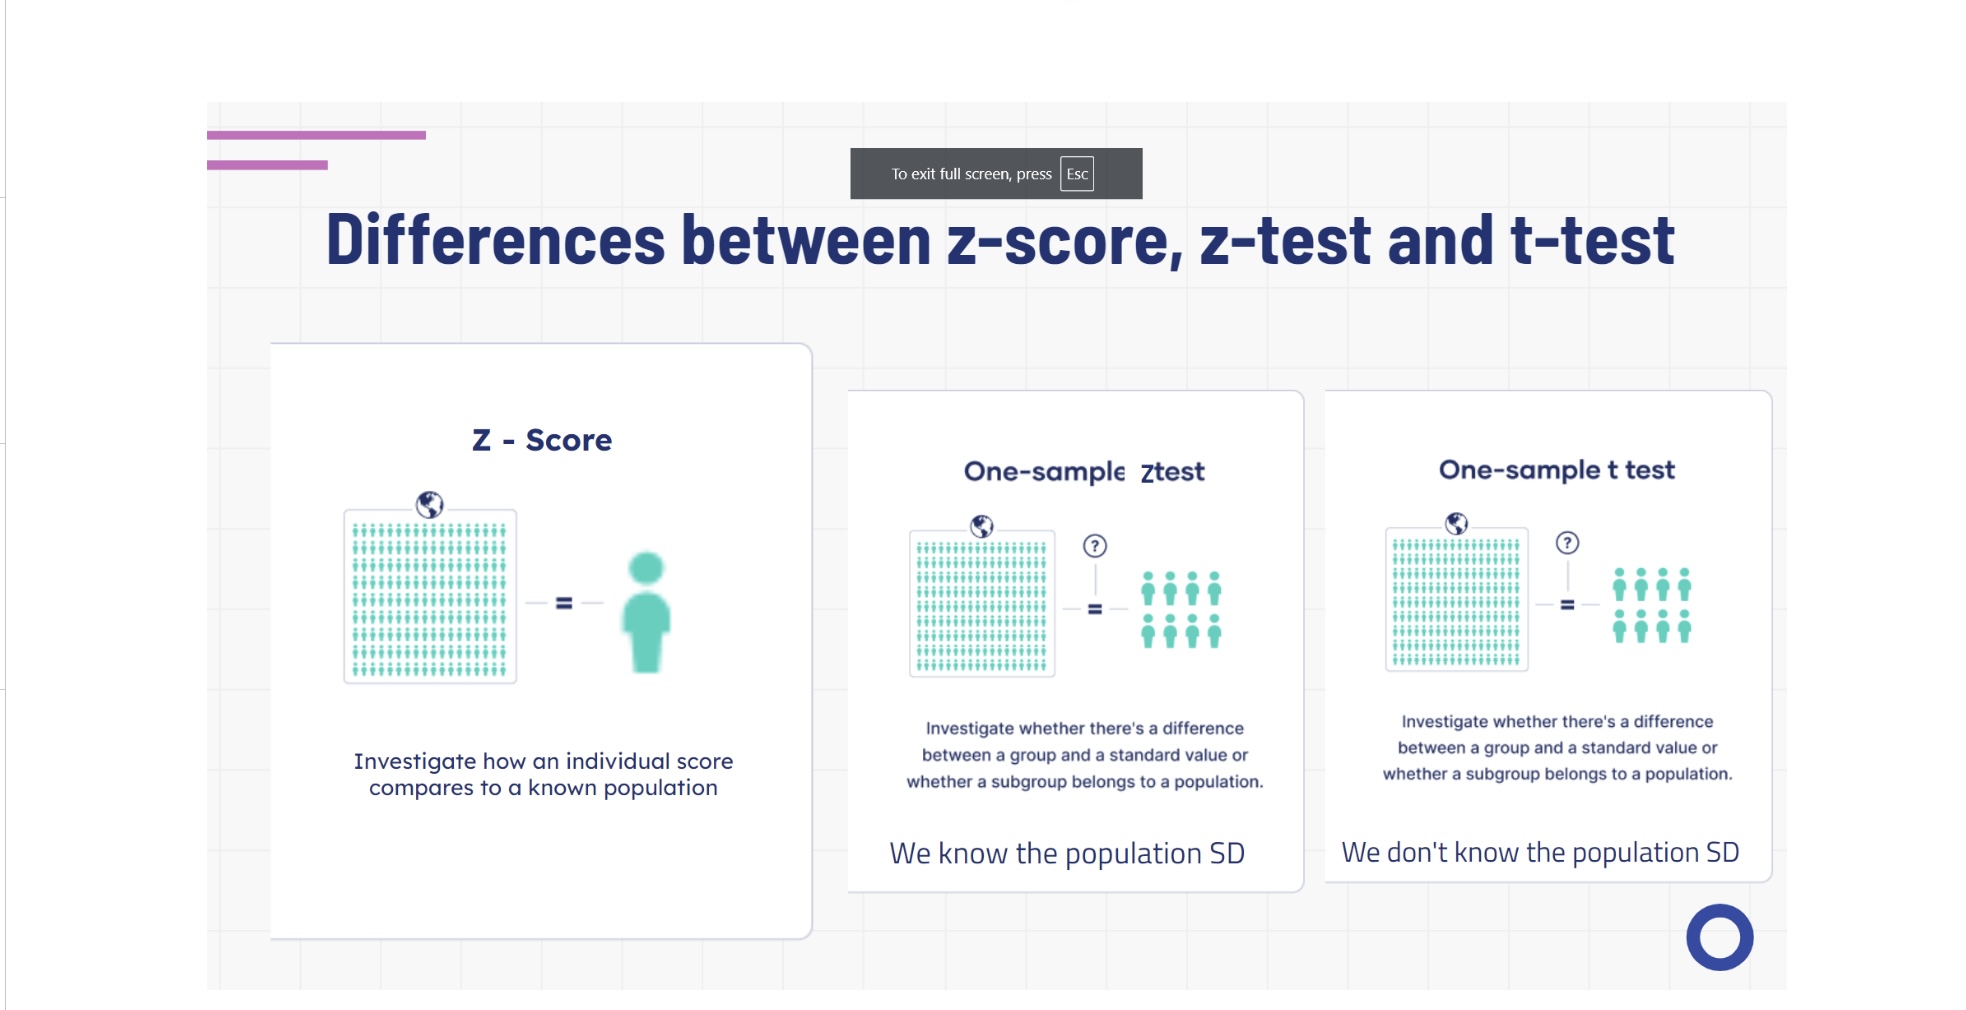
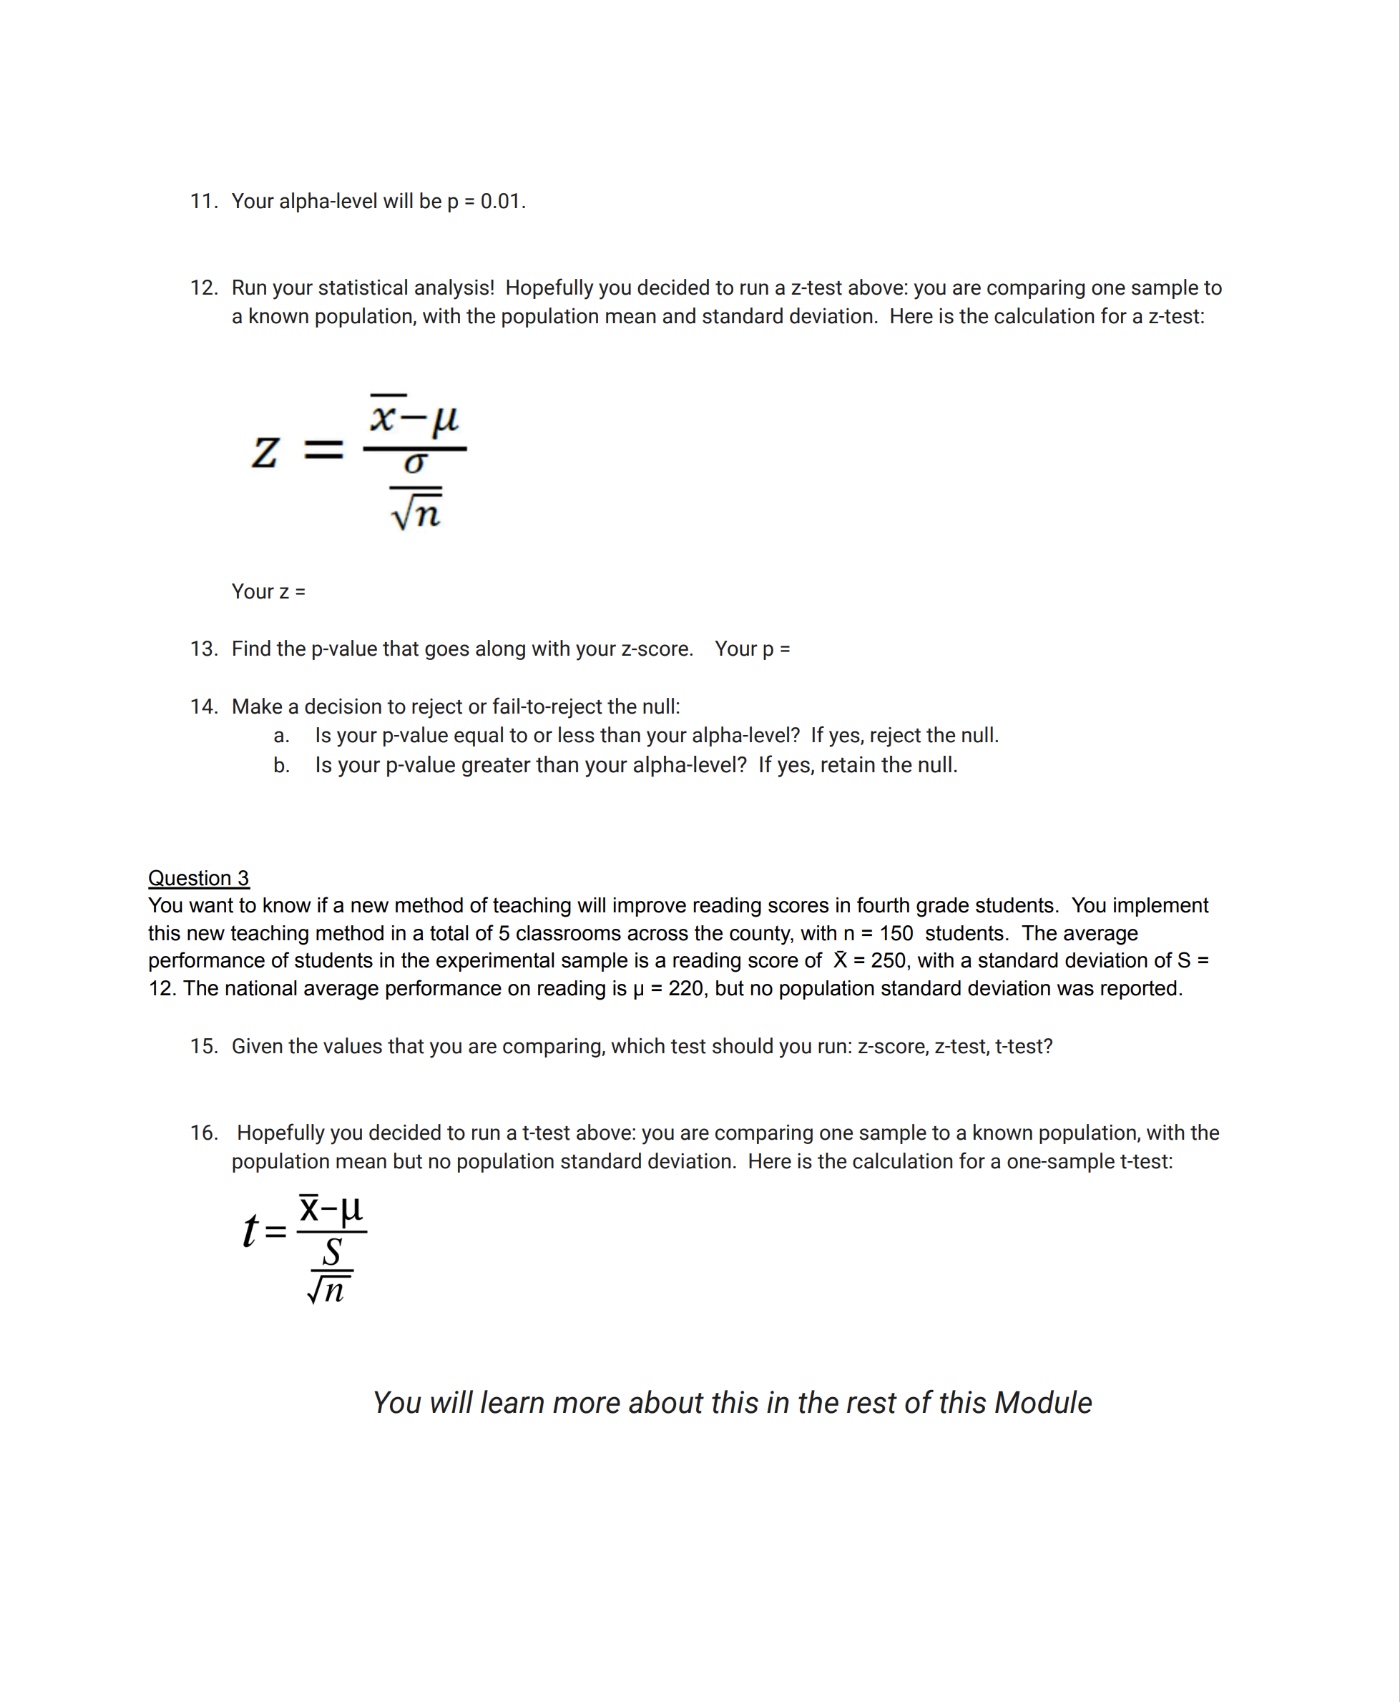
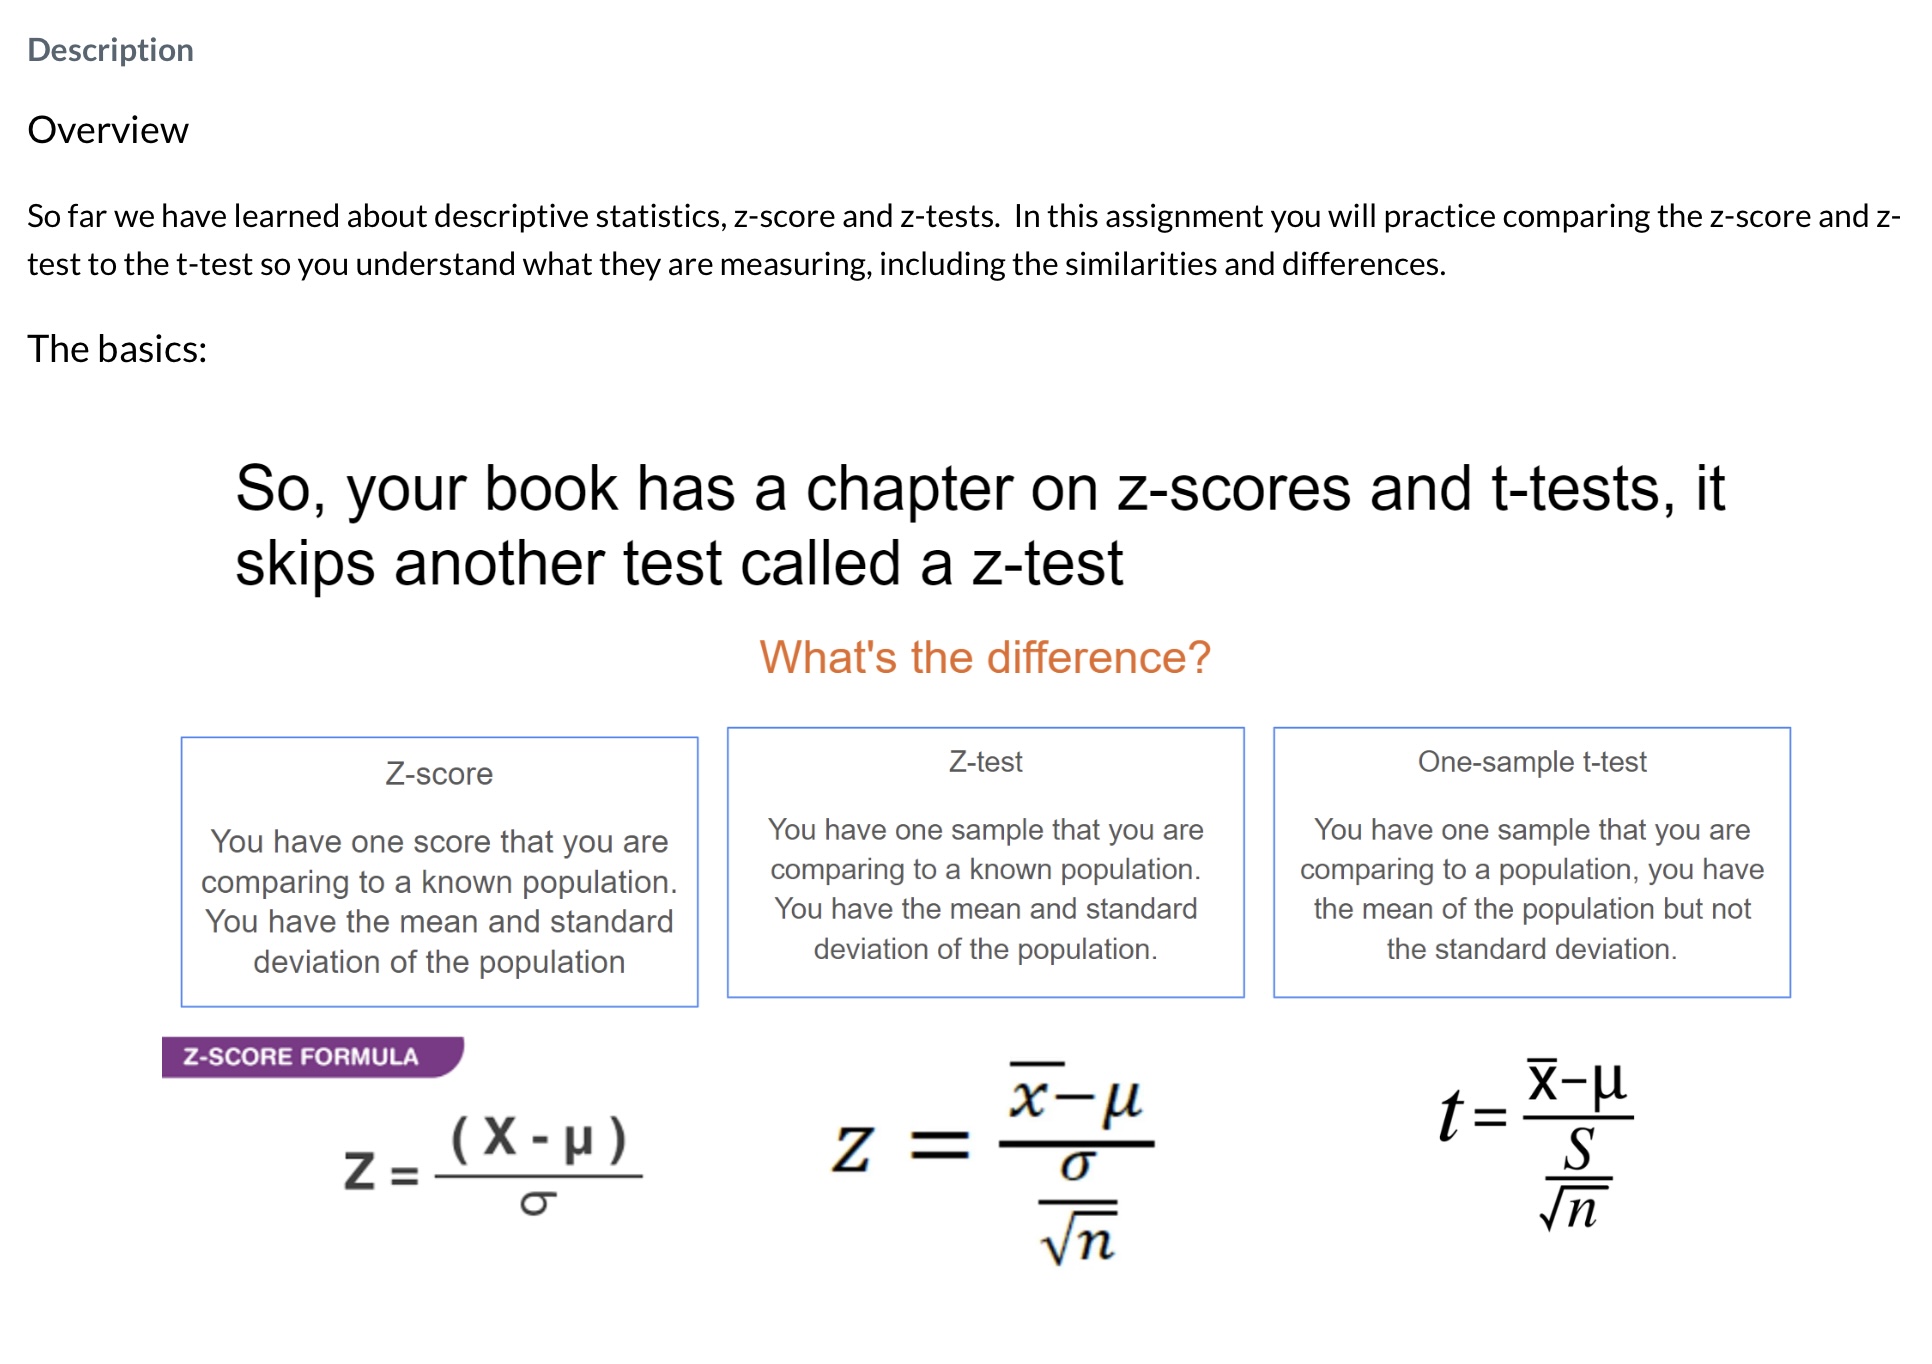
Question 1 You want to know if your niece has a learning disability, so you take her to get her I1Q tested. The known population mean for IQ scores is p = 100. The standard deviation is 6 = 15. Your niece scores 65. 1. Given the values that you are comparing, which test should you run: z-score, z-test, t-test? 2. What is your null and alternative hypothesis? 3. Isthis a one-tailed or two-tailed hypothesis? 4. Your alpha-level will be p = 0.05. Critical Value is 1.65 5. Run your statistical analysis! Hopefully you decided to run a z-score above: you are comparing one value to a known population. Here is the calculation for a z-score: _(X-p) o Yourz = 6. Find the p-value that goes along with your z-score. Yourp = 7. Make a decision to reject or fail-to-reject the null: a. Isyour p-value equal to or less than your alpha-level? If yes, reject the null. b. Is your p-value greater than your alpha-level? If yes, retain the null. Question 2 You want to know if the number of global fires per year has increased in the last 10 years compared to the previous 300 years. You sample from satellite data collected from each major continent over the last 10 years, and get a sample mean of X = 71 fires per year, with a sample size of n = 1000. Over the last 300 years, the average number of global fires has been p = 100 per year, and the standard deviation is o = 25. 8. Given the values that you are comparing, which test should you run: z-score, z-test, t-test? 9. Whatis your null and alternative hypothesis? 10. Is this a one-tailed or two-tailed hypothesis? Video with many examples: Test Statistics: Crash Cqurse Statistics #26 HOW DO WE KNOW IF IT'S AN EFFECT OR RANDOM VARIATION??2? ) # ) 26 Y| Assignment: After learning about the difference between the 3 tests, complete this practice assignment to practice identifying the difference between each test. You will also practice the steps of hypothesis testing while completing the assingment. Assignment : Downloadable link To exit full screen, press | Esc Differences between z-score, z-test and t-test Z - Score One-sample ztest One-sample t test ? ? iriititititiiliili Investigate whether there's a difference Investigate whether there's a difference between a group and a standard value or Investigate how an individual score between a group and a standard value or compares to a known population whether a subgroup belongs to a population. whether a subgroup belongs to a population. We know the population SD We don't know the population SD O11. Your alpha-level will be p = 0.01. 12. Run your statistical analysis! Hopefully you decided to run a z-test above: you are comparing one sample to a known population, with the population mean and standard deviation. Here is the calculation for a z-test: i Z sile Your z = 13. Find the p-value that goes along with your z-score. Yourp = 14. Make a decision to reject or fail-to-reject the null: a. s your p-value equal to or less than your alpha-level? If yes, reject the null. b. Is your p-value greater than your alpha-level? If yes, retain the null. Question 3 You want to know if a new method of teaching will improve reading scores in fourth grade students. You implement this new teaching method in a total of 5 classrooms across the county, with n = 150 students. The average performance of students in the experimental sample is a reading score of X = 250, with a standard deviation of S = 12. The national average performance on reading is p = 220, but no population standard deviation was reported. 15. Given the values that you are comparing, which test should you run: z-score, z-test, t-test? 16. Hopefully you decided to run a t-test above: you are comparing one sample to a known population, with the population mean but no population standard deviation. Here is the calculation for a one-sample t-test: _X-p I==3 Jn You will learn more about this in the rest of this Module Description Overview So far we have learned about descriptive statistics, z-score and z-tests. In this assignment you will practice comparing the z-score and z- test to the t-test so you understand what they are measuring, including the similarities and differences. The basics: So, your book has a chapter on z-scores and t-tests, it skips another test called a z-test What's the difference? Z-score Z-test One-sample t-test You have one score that you are You have one sample that you are You have one sample that you are comparing to a known population comparing to a known population. comparing to a population, you have You have the mean and standard You have the mean and standard the mean of the population but not deviation of the population deviation of the population. the standard deviation. _ (X-u) b o Jn Z sie
Step by Step Solution
There are 3 Steps involved in it
Step: 1
Get Instant Access to Expert-Tailored Solutions
See step-by-step solutions with expert insights and AI powered tools for academic success
Step: 2
Step: 3
Ace Your Homework with AI
Get the answers you need in no time with our AI-driven, step-by-step assistance