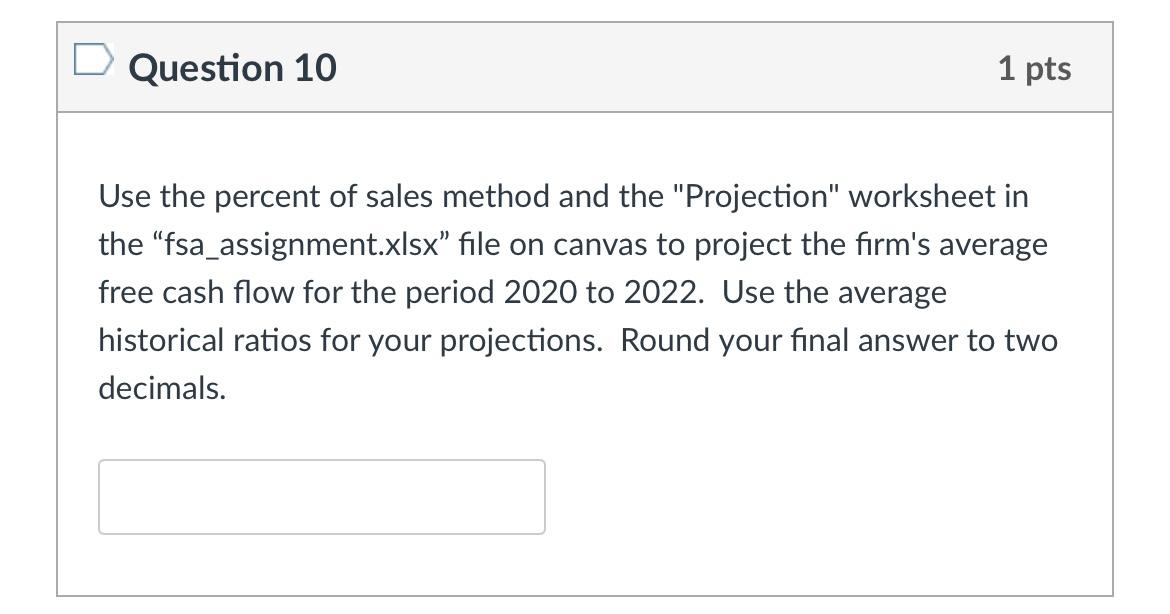
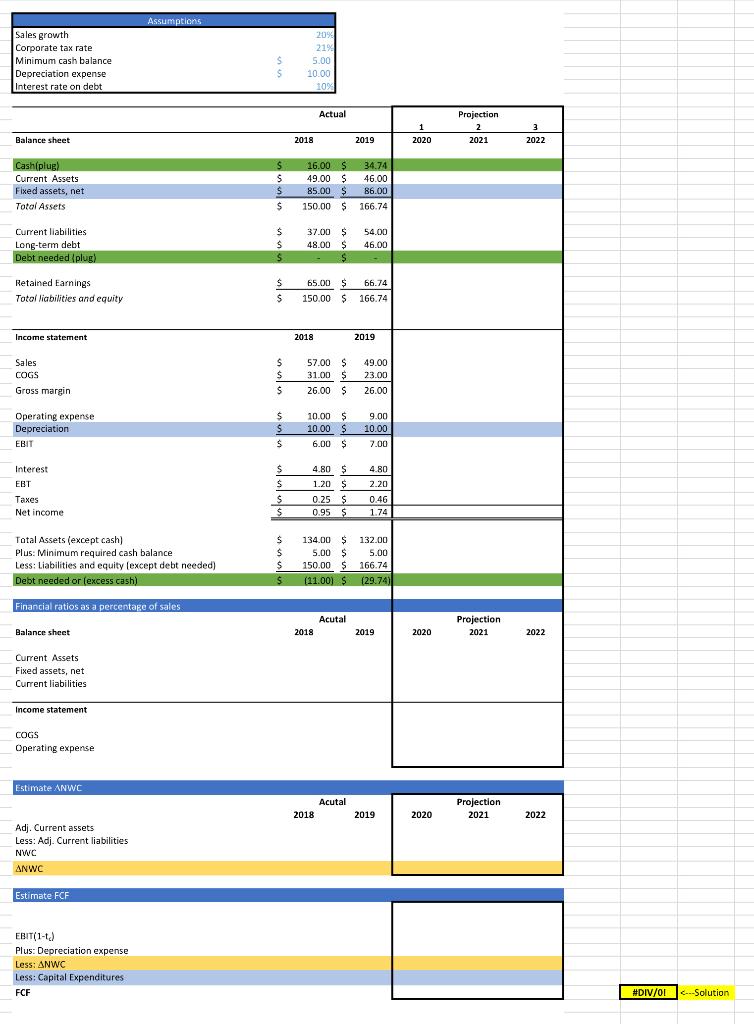
Question 10 1 pts Use the percent of sales method and the "Projection" worksheet in the fsa_assignment.xlsx" file on canvas to project the firm's average free cash flow for the period 2020 to 2022. Use the average historical ratios for your projections. Round your final answer to two decimals. Assumptions Sales growth Corporate tax rate Minimum cash balance Depreciation expense Interest rate on debt $ S 209 21% 5.00 10.00 10% Actual 1 1 2020 Projection 2 2021 3 2022 Balance sheet 2018 2019 Cash plug) Current Assets Fixed assets, net Total Assets $ S $ 16.00 $ 49.00 $ 85.00 $ 150.00 $ 34.74 46.00 86.00 166.74 $ Current liabilities Long-term debt Debt needed plug) $ $ S 37.00 $ 48.00 $ 54.00 46.00 Retained Earnings Total liabilities and equity $ $ 65.00 $ 66.74 150.00 $ 166.74 Income statement 2018 2019 Sales COGS Gross margin $ $ $ 57.00 $ 31.00 $ 26.00 $ 49.00 23.00 26.00 Operating expense Depreciation EBIT $ $ $ $ 10.00 $ 10.00 $ 6.00 $ 9.00 10.00 7.00 Interest EBT Taxes Net income $ $ $ $ 4.80 $ 1.20 $ 0.25 $ 0.95 $ 4.80 2.20 0.46 1.74 Total Assets (except cash) Plus: Minimum required cash balance Less: Liabilities and equity (except debt needed) Debt needed or (excess cash) $ $ S $ $ 134.00 $ 132.00 5.00 $ 5.00 150.00 $ 166.74 (11.00) $ 129.74) Financial ratios as a percentage of sales a Acutal Projection 2021 Balance sheet 2018 2019 2020 2022 Current Assets Fixed assets, net Current liabilities Income statement COGS Operating expense Estimate ANWC Acutal 2018 Projection 2021 2019 2020 2022 Adj. Current assets Less: Adj. Current liabilities NWC ANWC Estimate FCF EBIT(1-1) Plus: Depreciation expense Less: ANWC Less: Capital Expenditures FCF #DIV/01 C-Solution Question 10 1 pts Use the percent of sales method and the "Projection" worksheet in the fsa_assignment.xlsx" file on canvas to project the firm's average free cash flow for the period 2020 to 2022. Use the average historical ratios for your projections. Round your final answer to two decimals. Assumptions Sales growth Corporate tax rate Minimum cash balance Depreciation expense Interest rate on debt $ S 209 21% 5.00 10.00 10% Actual 1 1 2020 Projection 2 2021 3 2022 Balance sheet 2018 2019 Cash plug) Current Assets Fixed assets, net Total Assets $ S $ 16.00 $ 49.00 $ 85.00 $ 150.00 $ 34.74 46.00 86.00 166.74 $ Current liabilities Long-term debt Debt needed plug) $ $ S 37.00 $ 48.00 $ 54.00 46.00 Retained Earnings Total liabilities and equity $ $ 65.00 $ 66.74 150.00 $ 166.74 Income statement 2018 2019 Sales COGS Gross margin $ $ $ 57.00 $ 31.00 $ 26.00 $ 49.00 23.00 26.00 Operating expense Depreciation EBIT $ $ $ $ 10.00 $ 10.00 $ 6.00 $ 9.00 10.00 7.00 Interest EBT Taxes Net income $ $ $ $ 4.80 $ 1.20 $ 0.25 $ 0.95 $ 4.80 2.20 0.46 1.74 Total Assets (except cash) Plus: Minimum required cash balance Less: Liabilities and equity (except debt needed) Debt needed or (excess cash) $ $ S $ $ 134.00 $ 132.00 5.00 $ 5.00 150.00 $ 166.74 (11.00) $ 129.74) Financial ratios as a percentage of sales a Acutal Projection 2021 Balance sheet 2018 2019 2020 2022 Current Assets Fixed assets, net Current liabilities Income statement COGS Operating expense Estimate ANWC Acutal 2018 Projection 2021 2019 2020 2022 Adj. Current assets Less: Adj. Current liabilities NWC ANWC Estimate FCF EBIT(1-1) Plus: Depreciation expense Less: ANWC Less: Capital Expenditures FCF #DIV/01 C-Solution