Answered step by step
Verified Expert Solution
Link Copied!

Question

1 Approved Answer

Question 10 --/5 (a) The projected enrollment (in thousands of public and private schools in the u.S. in 2015 is given in the table: Type
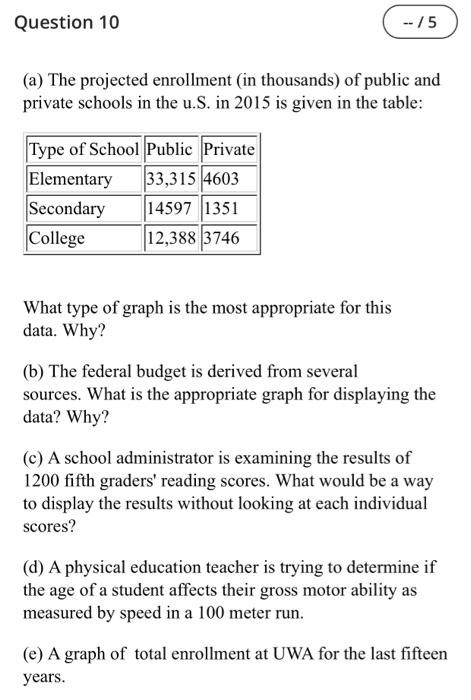
image text in transcribed
Question 10 --/5 (a) The projected enrollment (in thousands of public and private schools in the u.S. in 2015 is given in the table: Type of School Public Private Elementary 33,315 4603 Secondary 14597 1351 College 12,388 3746 What type of graph is the most appropriate for this data. Why? (b) The federal budget is derived from several sources. What is the appropriate graph for displaying the data? Why? (c) A school administrator is examining the results of 1200 fifth graders' reading scores. What would be a way to display the results without looking at each individual scores? (d) A physical education teacher is trying to determine if the age of a student affects their gross motor ability as measured by speed in a 100 meter run. (e) A graph of total enrollment at UWA for the last fifteen years

Step by Step Solution

There are 3 Steps involved in it

Step: 1

blur-text-image

Get Instant Access to Expert-Tailored Solutions

See step-by-step solutions with expert insights and AI powered tools for academic success

Step: 2

blur-text-image

Step: 3

blur-text-image

Ace Your Homework with AI

Get the answers you need in no time with our AI-driven, step-by-step assistance

Get Started

Recommended Textbook for

Beyond Bitcoin Economics Of Digital Currencies And Blockchain Technologies

Authors: Hanna Halaburda, Miklos Sarvary, Guillaume Haeringer

2nd Edition

3030889300,3030889319

More Books

Students also viewed these Finance questions

Question

5. What is a SMART Objective? Please provide an example.

Answered: 1 week ago