**Question 10**: Now, we would like to explore the impact of having less samples in the signal which also means less samples available for performing denoising. Currently, the signal has 500 samples, with 50 samples for each of the 10 intervals. Take your noisy signal generated in question 6 above and create a new signal with one half of the sampling rate. Basically, take your noisy signal and remove every other sample. This new signal will be length 250 samples.
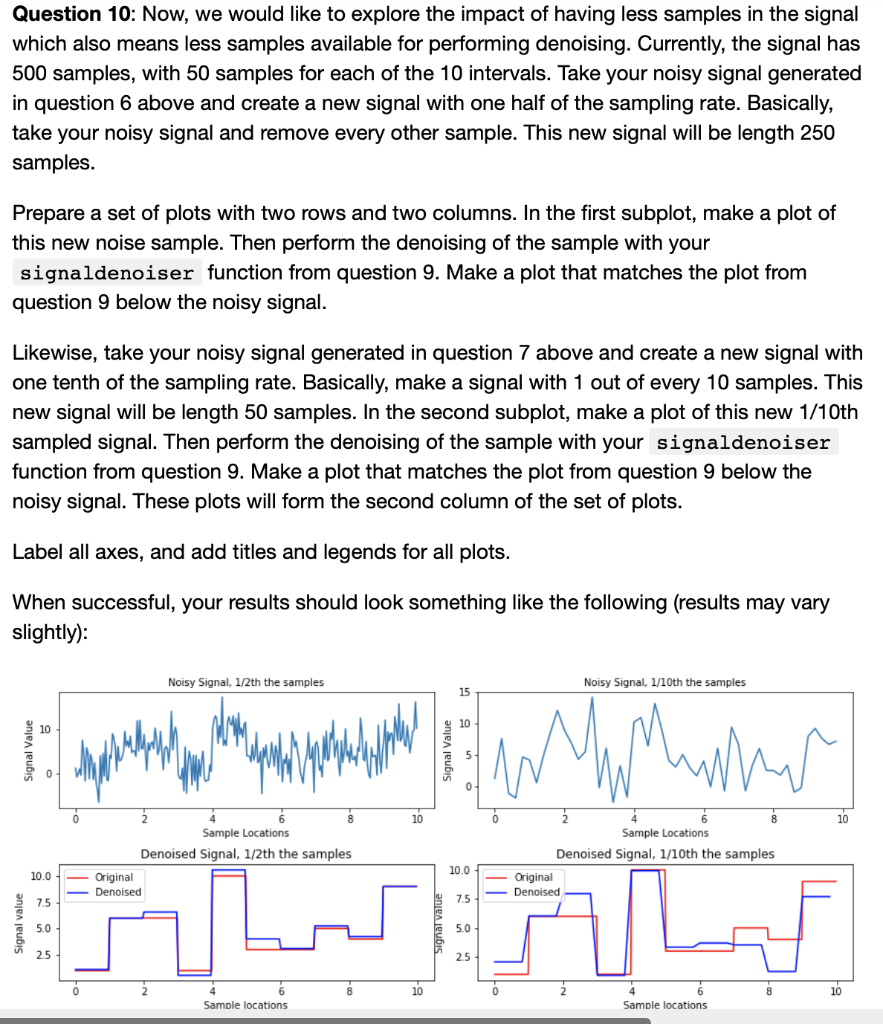
Prepare a set of plots with two rows and two columns. In the first subplot, make a plot of this new noise sample. Then perform the denoising of the sample with your `signaldenoiser` function from question 9. Make a plot that matches the plot from question 9 below the noisy signal.
Likewise, take your noisy signal generated in question 7 above and create a new signal with one tenth of the sampling rate. Basically, make a signal with 1 out of every 10 samples. This new signal will be length 50 samples. In the second subplot, make a plot of this new 1/10th sampled signal. Then perform the denoising of the sample with your `signaldenoiser` function from question 9. Make a plot that matches the plot from question 9 below the noisy signal. These plots will form the second column of the set of plots.
Label all axes, and add titles and legends for all plots.
When successful, your results should look something like the following (results may vary slightly):
Question 10: Now, we would like to explore the impact of having less samples in the signal which also means less samples available for performing denoising. Currently, the signal has 500 samples, with 50 samples for each of the 10 intervals. Take your noisy signal generated in question 6 above and create a new signal with one half of the sampling rate. Basically, take your noisy signal and remove every other sample. This new signal will be length 250 samples. Prepare a set of plots with two rows and two columns. In the first subplot, make a plot of this new noise sample. Then perform the denoising of the sample with your signaldenoiser function from question 9. Make a plot that matches the plot from question 9 below the noisy signal. Likewise, take your noisy signal generated in question 7 above and create a new signal with one tenth of the sampling rate. Basically, make a signal with 1 out of every 10 samples. This new signal will be length 50 samples. In the second subplot, make a plot of this new 1/10th sampled signal. Then perform the denoising of the sample with your signaldenoiser function from question 9. Make a plot that matches the plot from question 9 below the noisy signal. These plots will form the second column of the set of plots. Label all axes, and add titles and legends for all plots. When successful, your results should look something like the following (results may vary slightly): Noisy Signal, 1/2th the samples Noisy Signal, 1/10th the samples Signal Value Signal Value 51 Sample Locations Denoised Signal, 1/10th the samples Sample Locations Denoised Signal, 1/2th the samples Original Denoised - Original Denoised Signal value Signal value 01 Sample locations Sample locations Question 10: Now, we would like to explore the impact of having less samples in the signal which also means less samples available for performing denoising. Currently, the signal has 500 samples, with 50 samples for each of the 10 intervals. Take your noisy signal generated in question 6 above and create a new signal with one half of the sampling rate. Basically, take your noisy signal and remove every other sample. This new signal will be length 250 samples. Prepare a set of plots with two rows and two columns. In the first subplot, make a plot of this new noise sample. Then perform the denoising of the sample with your signaldenoiser function from question 9. Make a plot that matches the plot from question 9 below the noisy signal. Likewise, take your noisy signal generated in question 7 above and create a new signal with one tenth of the sampling rate. Basically, make a signal with 1 out of every 10 samples. This new signal will be length 50 samples. In the second subplot, make a plot of this new 1/10th sampled signal. Then perform the denoising of the sample with your signaldenoiser function from question 9. Make a plot that matches the plot from question 9 below the noisy signal. These plots will form the second column of the set of plots. Label all axes, and add titles and legends for all plots. When successful, your results should look something like the following (results may vary slightly): Noisy Signal, 1/2th the samples Noisy Signal, 1/10th the samples Signal Value Signal Value 51 Sample Locations Denoised Signal, 1/10th the samples Sample Locations Denoised Signal, 1/2th the samples Original Denoised - Original Denoised Signal value Signal value 01 Sample locations Sample locations