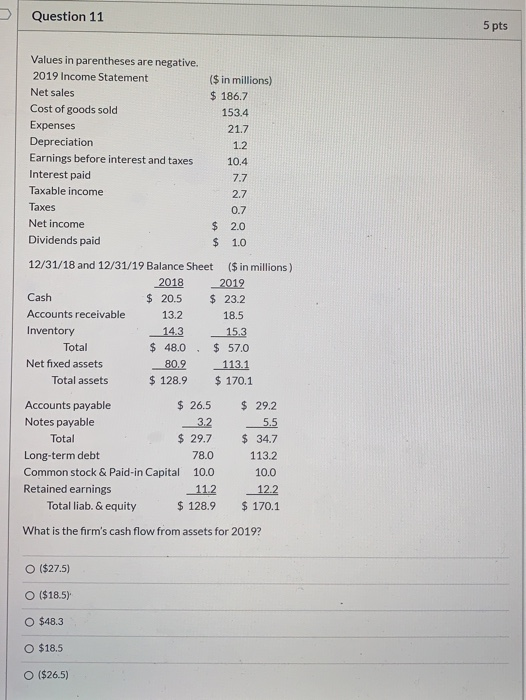
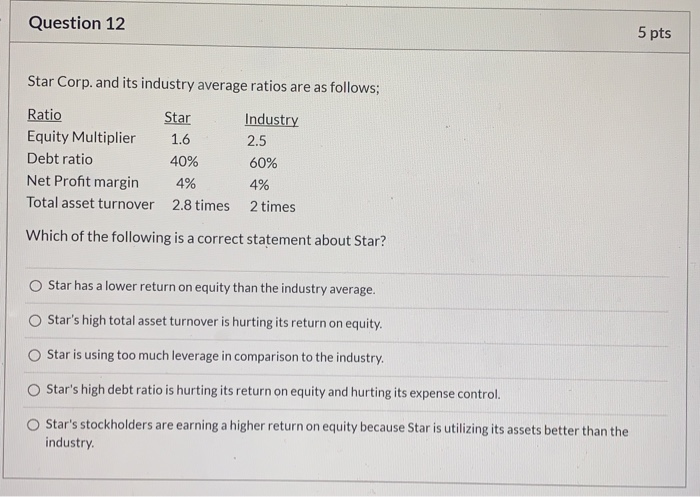
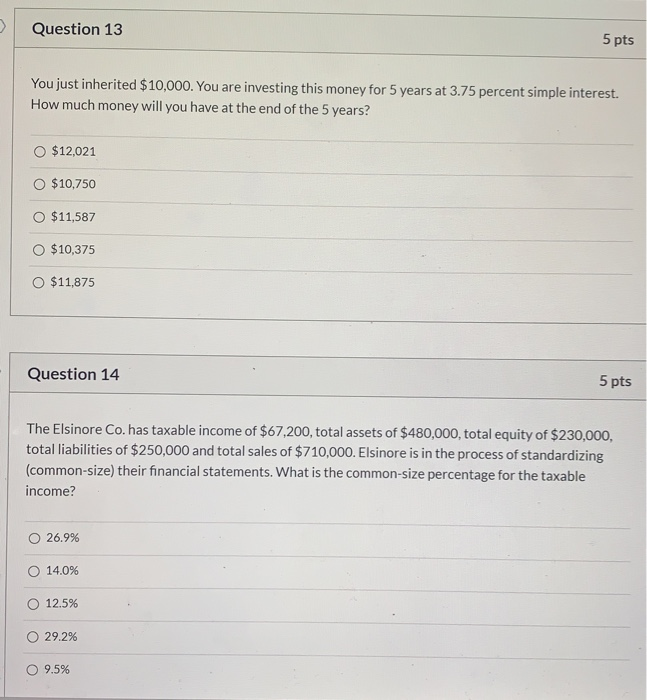
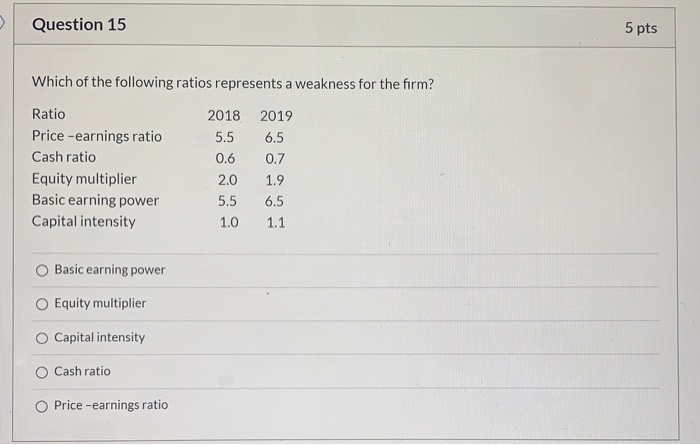
Question 11 5 pts Values in parentheses are negative. 2019 Income Statement Net sales Cost of goods sold Expenses Depreciation Earnings before interest and taxes Interest paid Taxable income Taxes Net income Dividends paid ($ in millions) $ 186.7 153.4 21.7 1.2 10.4 7.7 2.7 0.7 $ 2.0 $ 1.0 12/31/18 and 12/31/19 Balance Sheet ($ in millions) 2018 2019 Cash $ 20.5 $ 23.2 Accounts receivable 13.2 18.5 Inventory 14.3 15.3 Total $ 48.0 $ 57.0 Net fixed assets 80.2 113.1 Total assets $ 128.9 $ 170.1 Accounts payable $ 26.5 $ 29.2 Notes payable 3.2 5.5 Total $ 29.7 $ 34.7 Long-term debt 78.0 113.2 Common stock & Paid-in Capital 10.0 10.0 Retained earnings 112 12.2 Total liab. & equity $ 128.9 $ 170.1 What is the firm's cash flow from assets for 2019? O $27.5) O ($18.5) O $48.3 O $18.5 O ($26.5) Question 12 5 pts Star Corp. and its industry average ratios are as follows; Ratio Star Industry Equity Multiplier 1.6 2.5 Debt ratio 40% 60% Net Profit margin 4% 4% Total asset turnover 2.8 times 2 times Which of the following is a correct statement about Star? Star has a lower return on equity than the industry average. Star's high total asset turnover is hurting its return on equity. Star is using too much leverage in comparison to the industry. Star's high debt ratio is hurting its return on equity and hurting its expense control. Star's stockholders are earning a higher return on equity because Star is utilizing its assets better than the industry Question 13 5 pts You just inherited $10,000. You are investing this money for 5 years at 3.75 percent simple interest. How much money will you have at the end of the 5 years? $12,021 $10,750 $11,587 O $10,375 $11,875 Question 14 5 pts The Elsinore Co. has taxable income of $67,200, total assets of $480,000, total equity of $230,000, total liabilities of $250,000 and total sales of $710,000. Elsinore is in the process of standardizing (common-size) their financial statements. What is the common-size percentage for the taxable income? O 26.9% O 14.0% 12.5% 29.2% 9.5% Question 15 5 pts Which of the following ratios represents a weakness for the firm? Ratio Price - earnings ratio Cash ratio Equity multiplier Basic earning power Capital intensity 2018 5.5 0.6 2.0 5.5 1.0 2019 6.5 0.7 1.9 6.5 1.1 Basic earning power Equity multiplier Capital intensity Cash ratio Price -earnings ratio
