

Question
Question 12 5 Points 1 B C 2 Use the DuPont system and the following data: 3 Leverage ratio or Equity Multiplier 2.90 4 Total
Question 12
5 Points
| 1 | B | C |
| 2 | Use the DuPont system and the following data: | |
| 3 | Leverage ratio or Equity Multiplier | 2.90 |
| 4 | Total asset turnover | 1.80 |
| 5 | Net Profit Margin | 5.00% |
| 6 | Dividend Payout Ratio | 32.00% |
| 7 | Retention Ratio | 68.00% |
What is the DuPont ROA and ROE?
DuPont ROA = .0900 = 26.10%
DuPont ROE = .2610 = 9.00%
DuPont ROA = .0900 = 8.00%
DuPont ROE = .2610 = 25.10%
DuPont ROA = .0900 = 10.00%
DuPont ROE = .2610 = 27.10%
DuPont ROA = .0900 = 9.00%
DuPont ROE = .2610 = 26.10%
Question 11
5 Points
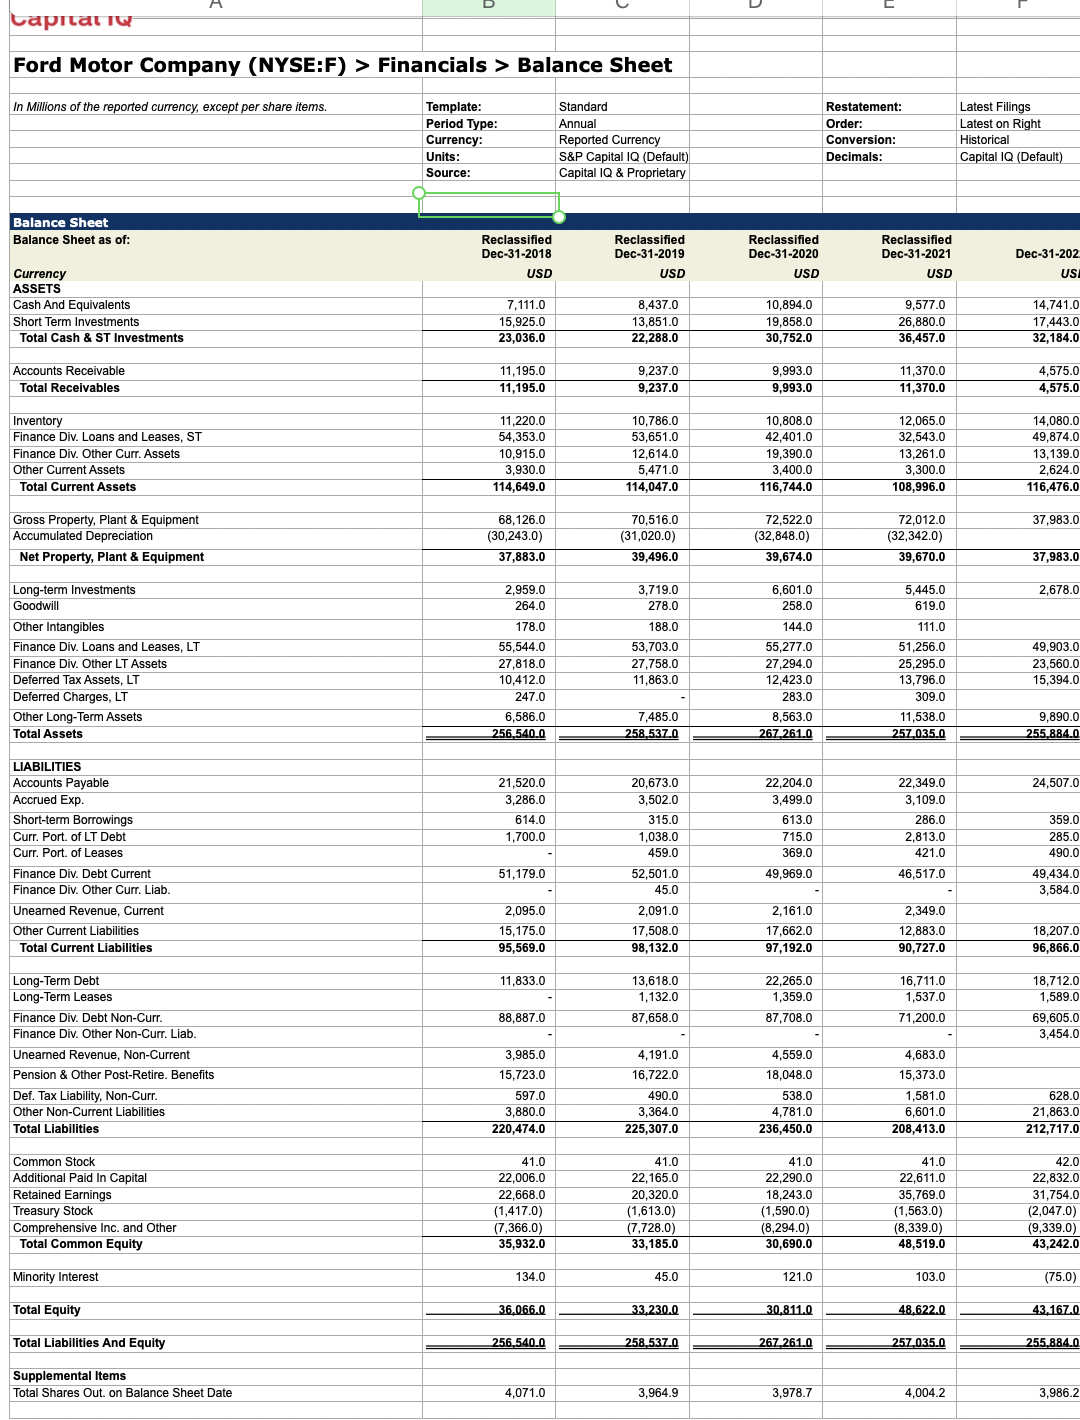
| Refer to the Week 12 Quiz Chapter 19 Ford Motor Company Data Suppose that Ford Motor Company utilizes Zero Debt and finances the Total Assets of the firm solely through common stock. What will be the revised Return on Equity (ROE)?
|
With zero debt, the revised ROE = 5.51%
With zero debt, the revised ROE = 6.98%
With zero debt, the revised ROE = 8.71%
With zero debt, the revised ROE = 7.89%
\begin{tabular}{|c|c|c|c|c|c|} \hline & & & & & \\ \hline Capr & & & & & \\ \hline Ford Motor Company (NYSE:F & incials > Bal & ance Sheet & & & \\ \hline & & & & & \\ \hline In Millions of the reported currency, except per share items. & Template: & Standard & & Restatement: & Latest Filings \\ \hline & Period Type: & Annual & & Order: & Latest on Right \\ \hline & Currency: & Reported Currency & & Conversion: & Historical \\ \hline & Units: & S\&P Capital IQ (Default) & & Decimals: & Capital IQ (Default) \\ \hline & Source: & Capital IQ \& Proprietary & & & \\ \hline & & & & & \\ \hline Balance Sheet & & & & & \\ \hline Balance Sheet as of: & \begin{tabular}{l} Reclassified \\ Dec-31-2018 \end{tabular} & \begin{tabular}{l} Reclassified \\ Dec-31-2019 \end{tabular} & \begin{tabular}{l} Reclassified \\ Dec-31-2020 \end{tabular} & \begin{tabular}{l} Reclassified \\ Dec-31-2021 \end{tabular} & Dec-31-202 \\ \hline Currency & USD & USD & USD & USD & \\ \hline ASSETS & & & & & \\ \hline Cash And Equivalents & 7,111.0 & 8,437.0 & 10,894.0 & 9,577.0 & 14,741.0 \\ \hline Short Term Investments & 15,925.0 & 13,851.0 & 19,858.0 & 26,880.0 & 17,443.0 \\ \hline Total Cash \& ST Investments & 23,036.0 & 22,288.0 & 30,752.0 & 36,457.0 & 32,184.0 \\ \hline Accounts Receivable & 11,195.0 & 9,237.0 & 9,993.0 & 11,370.0 & 4,575.0 \\ \hline Total Receivables & 11,195.0 & 9,237.0 & 9,993.0 & 11,370.0 & 4,575.0 \\ \hline Inventory & 112200 & 107860 & 108080 & 120650 & 140800 \\ \hline \begin{tabular}{l} Inventory \\ Finance Div. Loans and Leases, ST \end{tabular} & \begin{tabular}{l} 11,220.0 \\ 54,353.0 \end{tabular} & \begin{tabular}{l} 10,786.0 \\ 53,651.0 \end{tabular} & \begin{tabular}{l} 10,808.0 \\ 42,401.0 \end{tabular} & \begin{tabular}{l} 12,065.0 \\ 32,543.0 \end{tabular} & \begin{tabular}{l} 14,080.0 \\ 49,874.0 \end{tabular} \\ \hline Finance Div. Other Curr. Assets & \begin{tabular}{l} 0,0,915.0 \\ 10,915.0 \end{tabular} & 12,614.0 & 19,390.0 & 13,261.0 & 13,139.0 \\ \hline Other Current Assets & 3,930.0 & 5,471.0 & 3,400.0 & 3,300.0 & 2,624.0 \\ \hline Total Current Assets & 114,649.0 & 114,047.0 & 116,744.0 & 108,996.0 & 116,476.0 \\ \hline Gross Property, Plant \& Equipment & 68,126.0 & 70,516.0 & 72,522.0 & 72,012.0 & 37,983.0 \\ \hline Accumulated Depreciation & (30,243.0) & (31,020.0) & (32,848.0) & (32,342.0) & \\ \hline Net Property, Plant \& Equipment & 37,883.0 & 39,496.0 & 39,674.0 & 39,670.0 & 37,983.0 \\ \hline & & & & & \\ \hline Long-term Investments & 2,959.0 & 3,719.0 & 6,601.0 & 5,445.0 & 2,678.0 \\ \hline Goodwill & 264.0 & 278.0 & 258.0 & 619.0 & \\ \hline Other Intangibles & 178.0 & 188.0 & 144.0 & 111.0 & \\ \hline Finance Div. Loans and Leases, LT & 55,544.0 & 53,703.0 & 55,277.0 & 51,256.0 & 49,903.0 \\ \hline Finance Div. Other LT Assets & 27,818.0 & 27,758.0 & 27,294.0 & 25,295.0 & 23,560.0 \\ \hline Deferred Tax Assets, LT & 10,412.0 & 11,863.0 & 12,423.0 & 13,796.0 & 15,394.0 \\ \hline Deferred Charges, LT & 247.0 & - & 283.0 & 309.0 & \\ \hline Other Long-Term Assets & 6,586.0 & 7,485.0 & 8,563.0 & 11,538.0 & 9,890.0 \\ \hline Total Assets & 256,540.0 & 258,537,0 & 267,261.0 & 257,035.0 & 255,884,0 \\ \hline & & & & & \\ \hline LIABILITIES & & & & & \\ \hline Accounts Payable & 21,520.0 & 20,673.0 & 22,204.0 & 22,349.0 & 24,507.0 \\ \hline Accrued Exp. & 3,286.0 & 3,502.0 & 3,499.0 & 3,109.0 & \\ \hline Short-term Borrowings & 614.0 & 315.0 & 613.0 & 286.0 & 359.0 \\ \hline Curr. Port. of LT Debt & 1,700.0 & 1,038.0 & 715.0 & 2,813.0 & 285.0 \\ \hline Curr. Port. of Leases & - & 459.0 & 369.0 & 421.0 & 490.0 \\ \hline Finance Div. Debt Current & 51,179.0 & 52,501.0 & 49,969.0 & 46,517.0 & 49,434.0 \\ \hline Finance Div. Other Curr. Liab. & - & 45.0 & - & - & 3,584.0 \\ \hline Unearned Revenue, Current & 2,095.0 & 2,091.0 & 2,161.0 & 2,349.0 & \\ \hline Other Current Liabilities & 15,175.0 & 17,508.0 & 17,662.0 & 12,883.0 & 18,207.0 \\ \hline Total Current Liabilities & 95,569.0 & 98,132.0 & 97,192.0 & 90,727.0 & 96,866.0 \\ \hline Long-Term Debt & 11,833.0 & 13,618.0 & 22,265.0 & 16,711.0 & 18,712.0 \\ \hline Long-Term Leases & 11,003.0 & \begin{tabular}{r} 1,132.0 \\ \end{tabular} & \begin{tabular}{r} 2,203.0 \\ 1,359.0 \end{tabular} & 1,537.0 & 1,589.0 \\ \hline Finance Div. Debt Non-Curr. & 88,887.0 & 87,658.0 & 87,708.0 & 71,200.0 & 69,605.0 \\ \hline Finance Div. Other Non-Curr. Liab. & - & - & - & - & 3,454.0 \\ \hline Unearned Revenue, Non-Current & 3,985.0 & 4,191.0 & 4,559.0 & 4,683.0 & \\ \hline Pension \& Other Post-Retire. Benefits & 15,723.0 & 16,722.0 & 18,048.0 & 15,373.0 & \\ \hline Def. Tax Liability, Non-Curr. & 597.0 & 490.0 & 538.0 & 1,581.0 & 628.0 \\ \hline Other Non-Current Liabilities & 3,880.0 & 3,364.0 & 4,781.0 & 6,601.0 & 21,863.0 \\ \hline Total Liabilities & 220,474.0 & 225,307.0 & 236,450.0 & 208,413.0 & 212,717.0 \\ \hline Common Stock & 41.0 & 41.0 & 41.0 & 410 & 420 \\ \hline Additional Paid In Capital & \begin{tabular}{r} 41.0 \\ 22,006.0 \end{tabular} & 22,165.0 & \begin{tabular}{r} 41.0 \\ 22,290.0 \end{tabular} & \begin{tabular}{r} 41.0 \\ 22,611.0 \end{tabular} & 22,832.0 \\ \hline Retained Earnings & 22,668.0 & 20,320.0 & 18,243.0 & 35,769.0 & 31,754.0 \\ \hline Treasury Stock & (1,417.0) & (1,613.0) & (1,590.0) & (1,563.0) & (2,047.0) \\ \hline Comprehensive Inc. and Other & (7,366.0) & (7,728.0) & (8,294.0) & (8,339.0) & (9,339.0) \\ \hline Total Common Equity & 35,932.0 & 33,185.0 & 30,690.0 & 48,519.0 & 43,242.0 \\ \hline Minority Interest & 134.0 & 45.0 & 121.0 & 103.0 & (75.0) \\ \hline & & & & & \\ \hline Total Equity & 36,066,0 & 33,230.0 & 30,811,0 & 48,622.0 & 43,167,0 \\ \hline & & & & & \\ \hline Total Liabilities And Equity & 256,540.0 & 258,537,0 & 267,261.0 & 257,035.0 & 255,884,0 \\ \hline Supplemental Items & & & & & \\ \hline Total Shares Out. on Balance Sheet Date & 4,071.0 & 3,964.9 & 3,978.7 & 4,004.2 & 3,986.2 \\ \hline & & & & & \\ \hline \end{tabular}Step by Step Solution
There are 3 Steps involved in it
Step: 1

Get Instant Access to Expert-Tailored Solutions
See step-by-step solutions with expert insights and AI powered tools for academic success
Step: 2

Step: 3
Ace Your Homework with AI
Get the answers you need in no time with our AI-driven, step-by-step assistance
Get Started
Basic Finance An Introduction To Financial Institutions, Investments, And Management
Authors: Herbert B. Mayo
12th Edition
1337691011, 978-1337691017