

Answered step by step
Verified Expert Solution
Question
1 Approved Answer
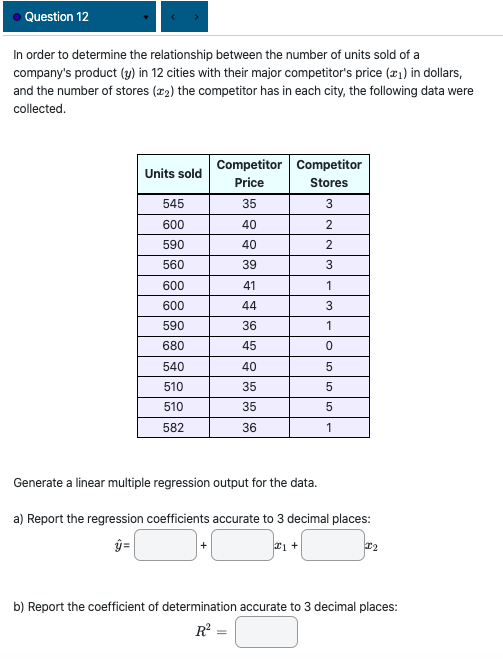
. Question 12 In order to determine the relationship between the number of units sold of a company's product (y) in 12 cities with their


Step by Step Solution
There are 3 Steps involved in it
Step: 1

Get Instant Access to Expert-Tailored Solutions
See step-by-step solutions with expert insights and AI powered tools for academic success
Step: 2

Step: 3
Ace Your Homework with AI
Get the answers you need in no time with our AI-driven, step-by-step assistance
Get Started
Introductory Statistics
Authors: Prem S. Mann
8th Edition
9781118473986, 470904100, 1118473981, 978-0470904107