

Answered step by step
Verified Expert Solution
Question
1 Approved Answer
question 12.11 a, b, c please help solve please answer 12.11 A, B and C - Determine the controlling 95 percent confidence level bConstruct an
question 12.11 a, b, c please help solve 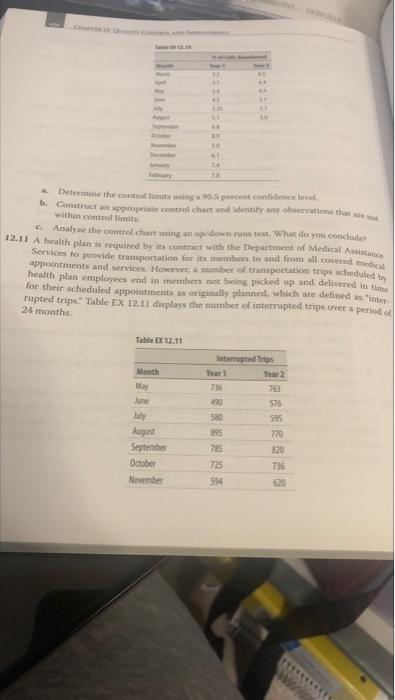
please answer 12.11 A, B and C 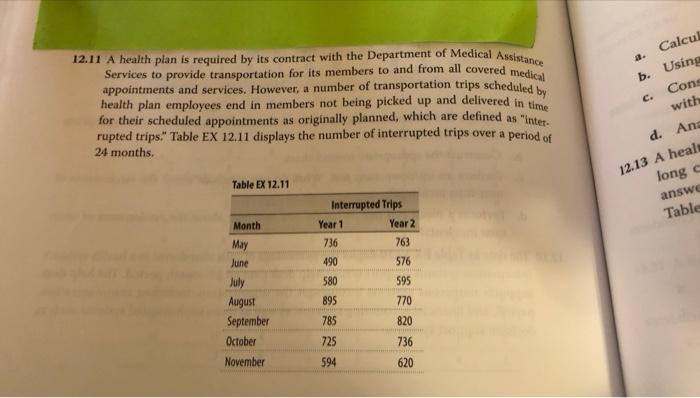
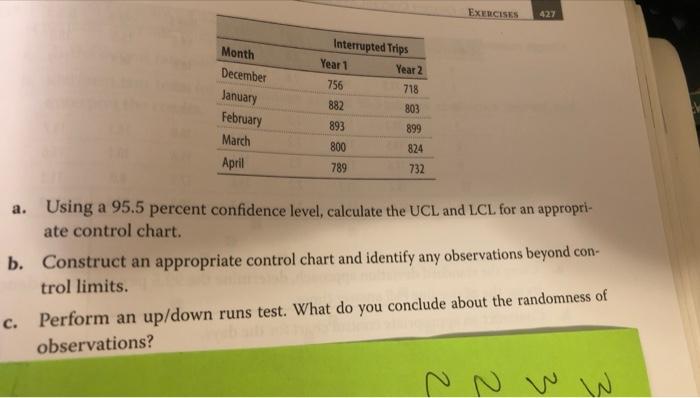
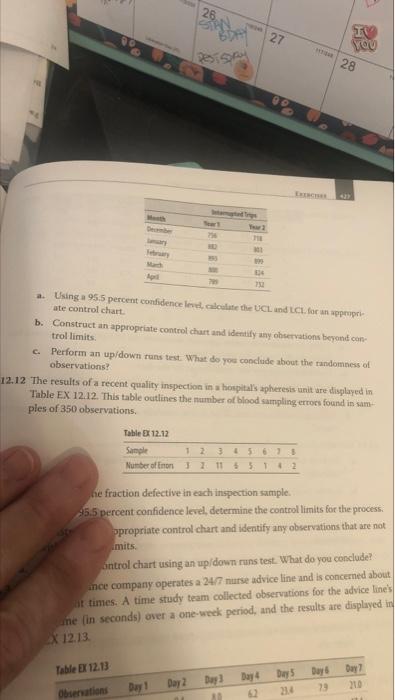
- Determine the controlling 95 percent confidence level bConstruct an appropriate control chart and Identity any observation that are within controllimit Analyze the ontrol chart using an up/down runs test. What do you conclude 12.11 A health plan is required by its contract with the Department of Medical Assistance Services to provide transportation for its members to and from all covered medias appointments and services. However, a number of transportation trips scheduled by health plan employees end in members not being picked up and delivered in time for their scheduled appointments as originally planned, which are defined as inter rupted trips." Table EX 12.11 displays the number of interrupted trips over a period of 24 months Table Ex 12.11 Month May June atted Trias Year 2 763 August September October November 580 195 785 725 594 595 770 820 736 620 26 27 19 you 28 a. Using a 95.5 percent confidence in the UCL und LCI. for an appropri ate control chart b. Construct an appropriate control chat and Identify any observations beyond con trol limits c. Perform an up/down runs test. What do you conclude about the randomness of observations? 12.12 The results of a recent quality inspection in a hospital's apheresis unit ure displayed in Table EX 12.12. This table outlines the number of blood sampling errors found in sam ples of 350 observations Table 12.12 Sample 356) Number of Enon 1111552 12 ne fraction defective in each inspection sample. 35.5 percent confidence level, determine the controllimits for the process. ppropriate control chart and identify any observations that are not mits. Sntrol chart using an up/down runs test. What do you conclude? ince company operates a 24/7 nurse advice line and is concerned about at times. A time study team collected observations for the advice line's ne (in seconds) over a one-week period, and the results are displayed in X 12.13 Table EX 12.13 Days Day Duy Day 23 Day 4 2 Day 20 Day! Observations 214 Calcul 12.11 A health plan is required by its contract with the Department of Medical Assistance 2. b. Using Services to provide transportation for its members to and from all covered medical appointments and services. However, a number of transportation trips scheduled by health plan employees end in members not being picked up and delivered in time for their scheduled appointments as originally planned, which are defined as "inter. rupted trips." Table EX 12.11 displays the number of interrupted trips over a period of 24 months C. Cons with d. Ang 12.13 A healt long answe Table EX 12.11 Table Interrupted Trips Year 1 Year 2 736 763 490 576 580 595 Month May June July August September October November 895 770 785 820 725 736 594 620 EXERCISES 427 Month December January February Interrupted Trips Year 1 Year 2 756 718 882 803 893 899 800 March April 824 732 789 a. Using a 95.5 percent confidence level, calculate the UCL and LCL for an appropri- ate control chart. b. Construct an appropriate control chart and identify any observations beyond con- trol limits. c. Perform an up/down runs test. What do you conclude about the randomness of observations? 2 3 3 2 - Determine the controlling 95 percent confidence level bConstruct an appropriate control chart and Identity any observation that are within controllimit Analyze the ontrol chart using an up/down runs test. What do you conclude 12.11 A health plan is required by its contract with the Department of Medical Assistance Services to provide transportation for its members to and from all covered medias appointments and services. However, a number of transportation trips scheduled by health plan employees end in members not being picked up and delivered in time for their scheduled appointments as originally planned, which are defined as inter rupted trips." Table EX 12.11 displays the number of interrupted trips over a period of 24 months Table Ex 12.11 Month May June atted Trias Year 2 763 August September October November 580 195 785 725 594 595 770 820 736 620 26 27 19 you 28 a. Using a 95.5 percent confidence in the UCL und LCI. for an appropri ate control chart b. Construct an appropriate control chat and Identify any observations beyond con trol limits c. Perform an up/down runs test. What do you conclude about the randomness of observations? 12.12 The results of a recent quality inspection in a hospital's apheresis unit ure displayed in Table EX 12.12. This table outlines the number of blood sampling errors found in sam ples of 350 observations Table 12.12 Sample 356) Number of Enon 1111552 12 ne fraction defective in each inspection sample. 35.5 percent confidence level, determine the controllimits for the process. ppropriate control chart and identify any observations that are not mits. Sntrol chart using an up/down runs test. What do you conclude? ince company operates a 24/7 nurse advice line and is concerned about at times. A time study team collected observations for the advice line's ne (in seconds) over a one-week period, and the results are displayed in X 12.13 Table EX 12.13 Days Day Duy Day 23 Day 4 2 Day 20 Day! Observations 214 Calcul 12.11 A health plan is required by its contract with the Department of Medical Assistance 2. b. Using Services to provide transportation for its members to and from all covered medical appointments and services. However, a number of transportation trips scheduled by health plan employees end in members not being picked up and delivered in time for their scheduled appointments as originally planned, which are defined as "inter. rupted trips." Table EX 12.11 displays the number of interrupted trips over a period of 24 months C. Cons with d. Ang 12.13 A healt long answe Table EX 12.11 Table Interrupted Trips Year 1 Year 2 736 763 490 576 580 595 Month May June July August September October November 895 770 785 820 725 736 594 620 EXERCISES 427 Month December January February Interrupted Trips Year 1 Year 2 756 718 882 803 893 899 800 March April 824 732 789 a. Using a 95.5 percent confidence level, calculate the UCL and LCL for an appropri- ate control chart. b. Construct an appropriate control chart and identify any observations beyond con- trol limits. c. Perform an up/down runs test. What do you conclude about the randomness of observations? 2 3 3 2 Step by Step Solution
There are 3 Steps involved in it
Step: 1

Get Instant Access to Expert-Tailored Solutions
See step-by-step solutions with expert insights and AI powered tools for academic success
Step: 2

Step: 3
Ace Your Homework with AI
Get the answers you need in no time with our AI-driven, step-by-step assistance
Get Started
Currency Wars Offense And Defense Through Systemic Thinking
Authors: Jeffrey Yi-Lin Forrest , Yirong Ying , Zaiwu Gong
1st Edition
3319677640,3319677659