Answered step by step
Verified Expert Solution
Link Copied!

Question

1 Approved Answer

Question 13 (20 points) See the figure below showing 30-year bond prices versus time. The discount rate is 5.0%. This is the same figure we
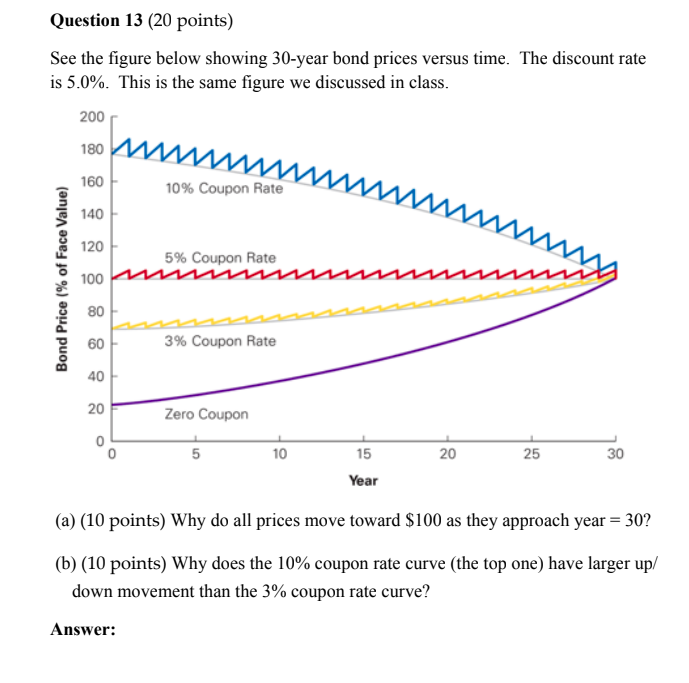
image text in transcribed

Question 13 (20 points) See the figure below showing 30-year bond prices versus time. The discount rate is 5.0%. This is the same figure we discussed in class. 200 180 mm mmmmmm 160 10% Coupon Rate 140 120 5% Coupon Rate Bond Price (% of Face Value) 100 mi 80 60 3% Coupon Rate 40 20 Zero Coupon 5 10 20 25 30 15 Year (a) (10 points) Why do all prices move toward $100 as they approach year = 30? (b) (10 points) Why does the 10% coupon rate curve (the top one) have larger up/ down movement than the 3% coupon rate curve

Step by Step Solution

There are 3 Steps involved in it

Step: 1

blur-text-image

Get Instant Access to Expert-Tailored Solutions

See step-by-step solutions with expert insights and AI powered tools for academic success

Step: 2

blur-text-image_2

Step: 3

blur-text-image_3

Ace Your Homework with AI

Get the answers you need in no time with our AI-driven, step-by-step assistance

Get Started

Recommended Textbook for

Public Finance An International Perspective

Authors: Joshua E. Greene

1st Edition

9814365041, 978-9814365048

More Books

Students also viewed these Finance questions

Question

Should you continue to deal with the entire group? Why or why not?

Answered: 1 week ago