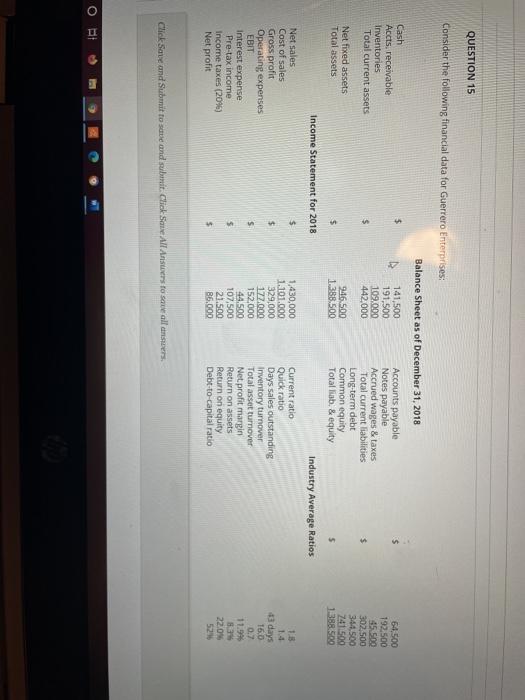
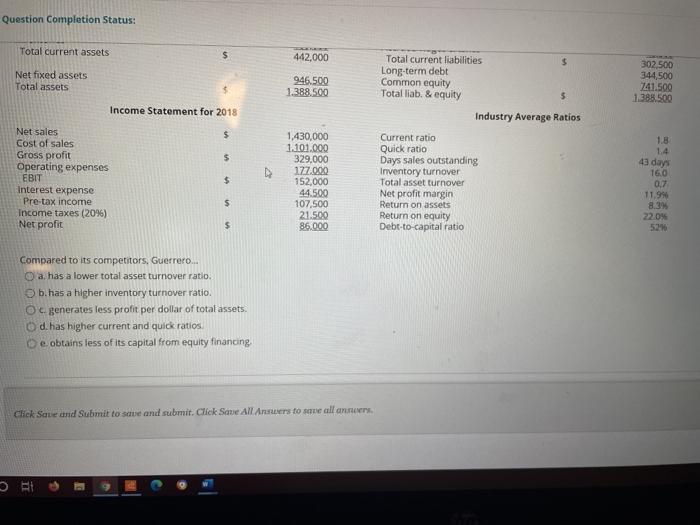
QUESTION 15 Consider the following financial data for Guerrero Enterprises: Balance Sheet as of December 31, 2018 $ Cash Accts, receivable Inventories Total current assets 141,500 191,500 109.000 442,000 Accounts payable Notes payable Accrued wages & taxes Total current liabilities Long-term debt Common equity Total lib. & equity 5 Industry Average Ratios 64,500 192.500 45.5.09 302.500 344.500 741.500 1388.500 Net fixed assets Total assets $ 946.500 1.388.500 Income Statement for 2018 $ $ Net sales Cost of sales Gross profit Operating expenses EBIT Interest expense Pre-tax income Income taxes (2096) Net profit $ 1.430,000 1.101.000 329,000 177.000 152.000 44.500 107,500 21.500 36.000 Current ratio Quick ratio Days sales outstanding Inventory turnover Total asset turnover Net profit margin on assets Return on equity Debt-to-capital ratio 13 days 160 0.7 11.99 83 22.04 5256 Click Save and Submit to save and subunit. Click Save All Ansters to save alla O IL Question Completion Status: Total current assets $ 442,000 Net fixed assets Total assets 946.500 1.388.500 Total current liabilities Long-term debt Common equity Total liab. & equity Industry Average Ratios 302.500 344,500 741.500 1.388.500 Income Statement for 2018 $ 1.8 1.4 $ 43 days Net sales Cost of sales Gross profit Operating expenses EBIT Interest expense Pre-tax income Income taxes (2096) Net profit $ 1,430,000 1.100.000 329,000 177.000 152,000 44.500 107,500 21.500 86.000 Current ratio Quick ratio Days sales outstanding Inventory turnover Total asset turnover Net profit margin Return on assets Return on equity Debt-to-capital ratio $ 16.0 0,7 11.99 8.3% 22.0% 527 $ Compared to its competitors, Guerrero... a has a lower total asset turnover ratio. b. has a higher inventory turnover ratio. O c. generates less profit per dollar of total assets. d. has higher current and quick ratios e.obtains less of its capital from equity financing Click Save and Submit to save and submit. Click Save All Answers to save all answers