Question 16 (0.5 points) The data below are the naptimes for 34 children in a daycare. Click here to open this data in StatCrunch. Compute
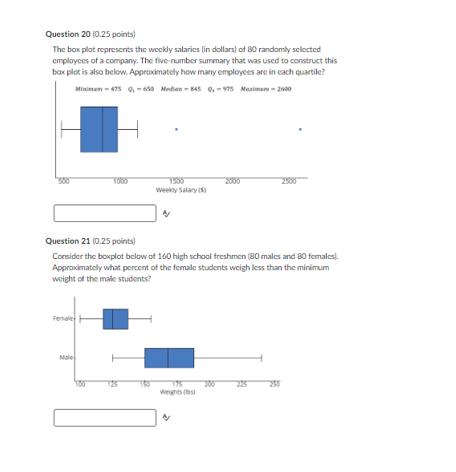
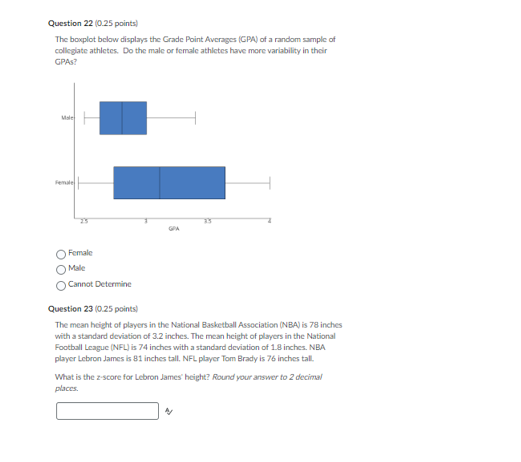
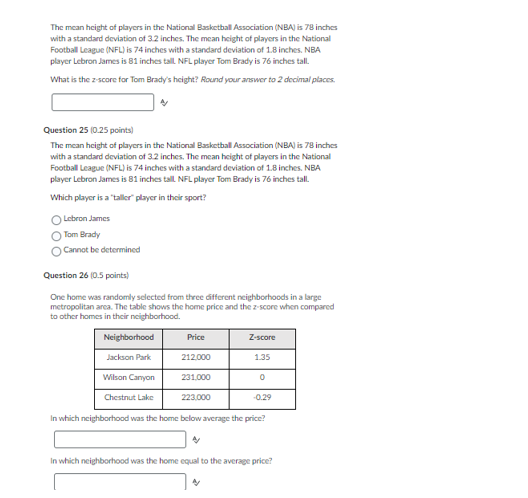
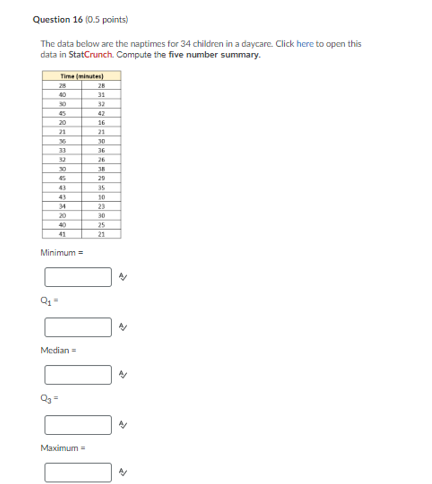
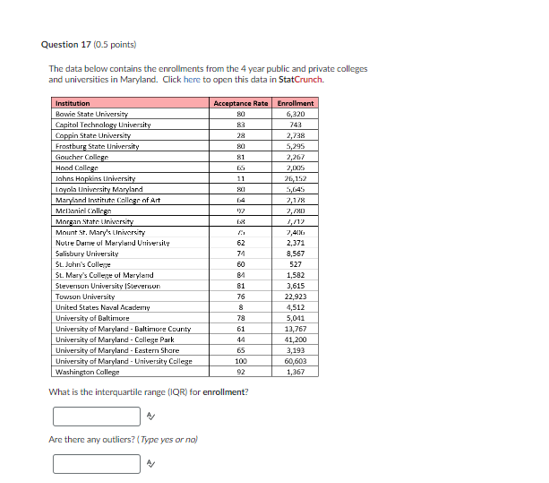
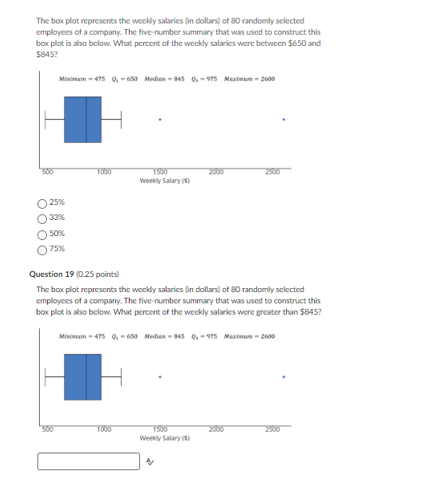
Question 16 (0.5 points) The data below are the naptimes for 34 children in a daycare. Click here to open this data in StatCrunch. Compute the five number summary. 31 50 43 30 16 21 Minimum = Q1- Median = Q1 = Maximum =Question 17 (0.5 points) The data below contains the enrollments from the 4 year public and private colleges and universities in Maryland. Click here to open this data in StatCrunch. Institution Acceptance Rate Enrollment Rowin State University 5.320 Capital Technology University 745 Coppin State University Frostburg State University 5,245 2,267 Hood College Johns Hopkins University 11 26 152 Loyola University Maryband ,645 Maryland Institute College of Art 2.178 Morgan State Inhersty Mount 31. Mary's University Notre Dame ul Maryland University 63 2.371 Salisbury University 8,567 SL John's College 527 SL. Mary's College of Maryland 1,582 Stevenson University ISseemmon 81 3,615 Towson University 76 22.923 United States Naval Academy 4,513 University of Baltimore 73 5,041 University of Maryland . Baltimore County 61 11,767 University of Maryland . College Park 14 41,200 University of Maryland - Eastern Shore 3,19 University of Maryland - University College 103 60.603 Washington College 1,367 What is the interquartile range (IQR) for enrollment? Are there any outliers? ( Type yes or no)The box plot represents the wockly salaries (in dollars) of 80 randomly selected employees of a company. The five-number summary that was used to construct this box plot is also below. What percent of the weekly salaries were between $450 and $845? Minimum - 473 4 - 650 Median - 845 0 -975 Maximum = 2609 TOOD Weekly Salary It) 25% 50x 75% Question 19 (0.25 points) The box plot represents the weekly salaries (in dollars) of 80 randomly selected employees of a company. The five-number summary that was used to construct this box plot is also below. What percent of the weekly salaries were greater than $8457 Micme -475 01 -030 Median = 145 01 -975 Maximum = 2609 2090 Weekly Salary istQuestion 20 [0.25 points] The box plot represents the weekly salaries (in dollars] of BO randomly selected employees of a company, The five number summary that was used to construct this box plot is also below. Approximately how many employees are in each quartile? Minimum - 475 0, - 650 Median - 845 4, - 175 Mariman = 2680 2520 Weekly Salary is Question 21 (0.25 points) Consider the boxplot below of 140 high school freshmen (80 males and BO females). Approximately what percent of the female students weigh less than the minimum weight of the male students? Fernley wright lopQuestion 22 (0.25 points) The boxplot below displays the Grade Point Averages [GPA) of a random sample of collegiate athletes. Do the male or female athletes have more variability in their GPAST Fonde GRA OFemale Male Cannot Determine Question 23 (0.25 points) The mean height of players in the National Basketball Association (NBA) is 78 inches with a standard deviation of 3.2 inches. The mean height of players in the National Football League [NFL] is 74 inches with a standard deviation of 1 8 inches. NBA player Lebron James Is 81 inches tall, NFL player Tom Brady is 76 inches tall. What is the z-score for Lebron James' height? Round your answer to 2 decimal places.The mean height of players in the National Basketball Association (NBA] is 78 inches with a standard deviation of 3.2 Inches, The mean height of players in the National Football League (NFL) is 74 inches with a standard deviation of 1.8 inches. NBA player Lebron James is 81 inches tall NFL player Tom Brady is 76 inches tall. What is the 2-score for Tom Brady's height? Round your answer to 2 decimal places. Question 25 (0.25 points] The mean height of players in the National Basketball Association (NBA] is 78 inches with a standard deviation of 3.2 Inches, The mean height of players in the National Football League (NFL) is 74 inches with a standard deviation of 1.8 inches. NBA player Lebron James is 81 inches tall NFL player Tom Brady is 76 inches tall. Which player is a "taller" player in their sport? Lebron James Tom Brady O Cannot be determined Question 26 [0.5 points) One home was randomly selected from three different neighborhoods in a large metropolitan area. The table shows the home price and the z-score when compared to other homes in their neighborhood. Neighborhood Price Z-score Jackson Park 212 000 1.35 Wilson Canyon 231.000 O Chestnut Lake 223 000 0.29 In which neighborhood was the home below average the price? In which neighborhood was the home equal to the average price
Step by Step Solution
There are 3 Steps involved in it
Step: 1
Get Instant Access to Expert-Tailored Solutions
See step-by-step solutions with expert insights and AI powered tools for academic success
Step: 2
Step: 3
Ace Your Homework with AI
Get the answers you need in no time with our AI-driven, step-by-step assistance