Answered step by step
Verified Expert Solution
Question
1 Approved Answer
Question 16 (1 point) What does an accumulation pattern on a stock chart generally indicate? stock prices are about to increase it is a sell

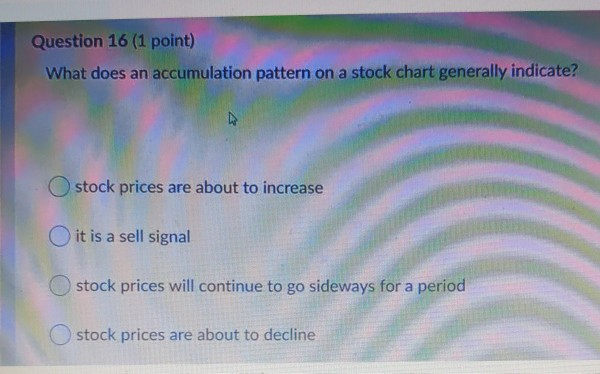
Question 16 (1 point) What does an accumulation pattern on a stock chart generally indicate? stock prices are about to increase it is a sell signal stock prices will continue to go sideways for a period stock prices are about to decline
Step by Step Solution
There are 3 Steps involved in it
Step: 1

Get Instant Access to Expert-Tailored Solutions
See step-by-step solutions with expert insights and AI powered tools for academic success
Step: 2

Step: 3

Ace Your Homework with AI
Get the answers you need in no time with our AI-driven, step-by-step assistance
Get Started


