Question 2 2 pts Angela recently discovered that the proportion of cat owners in Scranton, Pennsylvania, is 0.19. Suppose Angela were to select a random
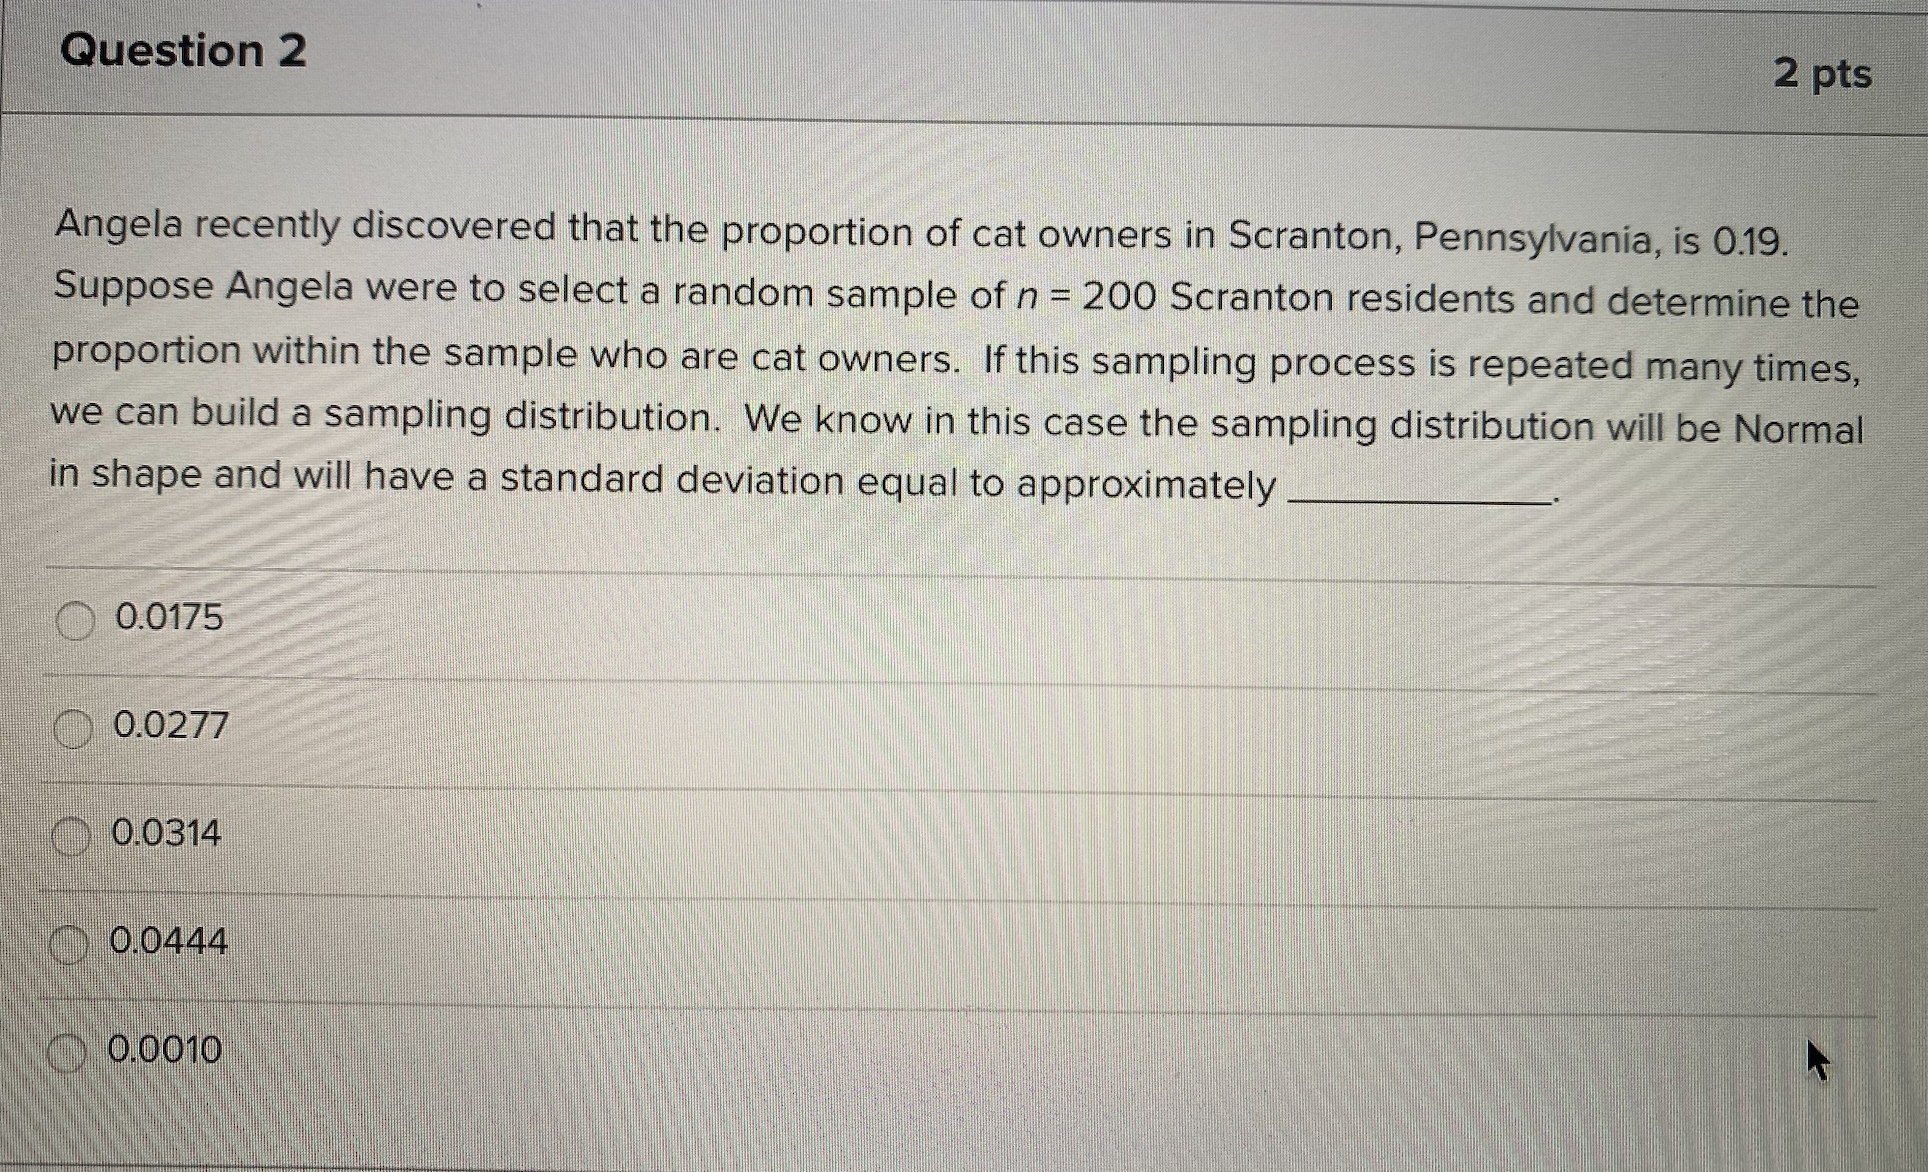
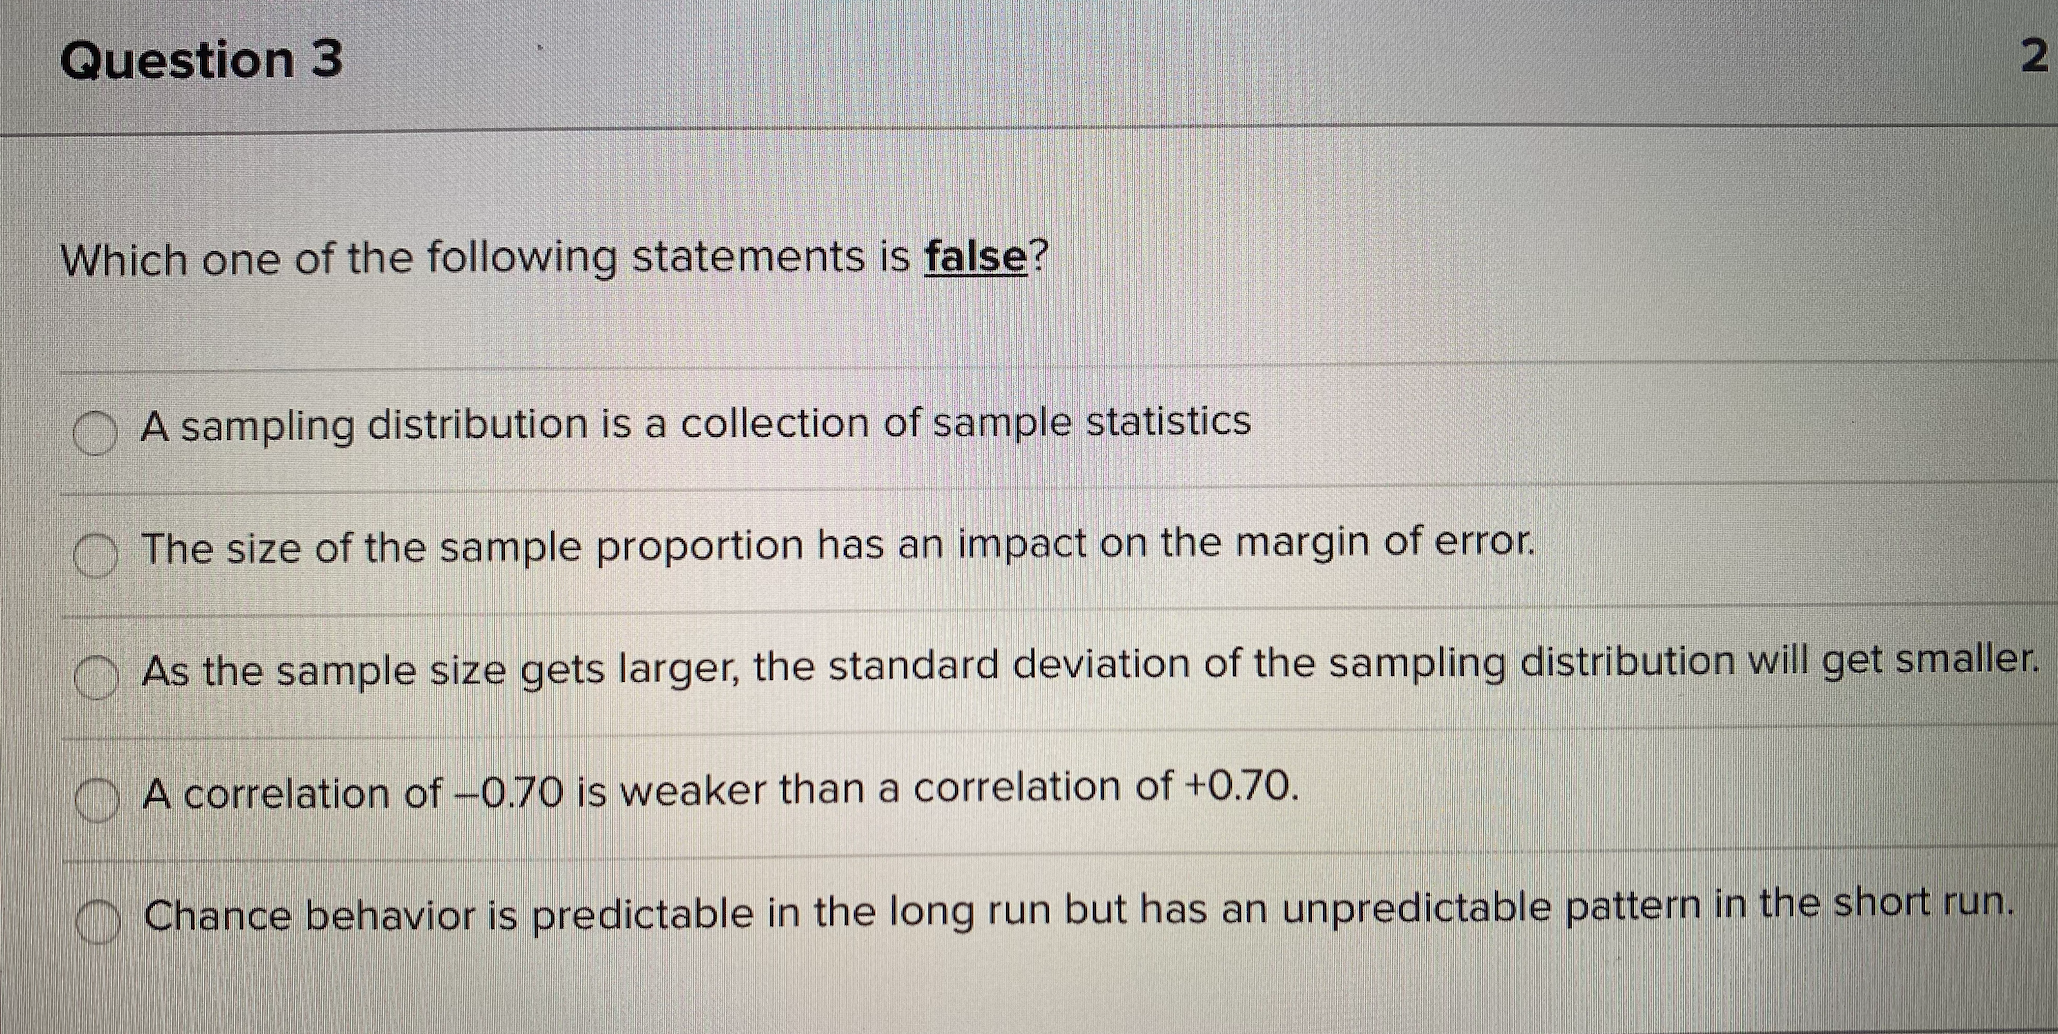
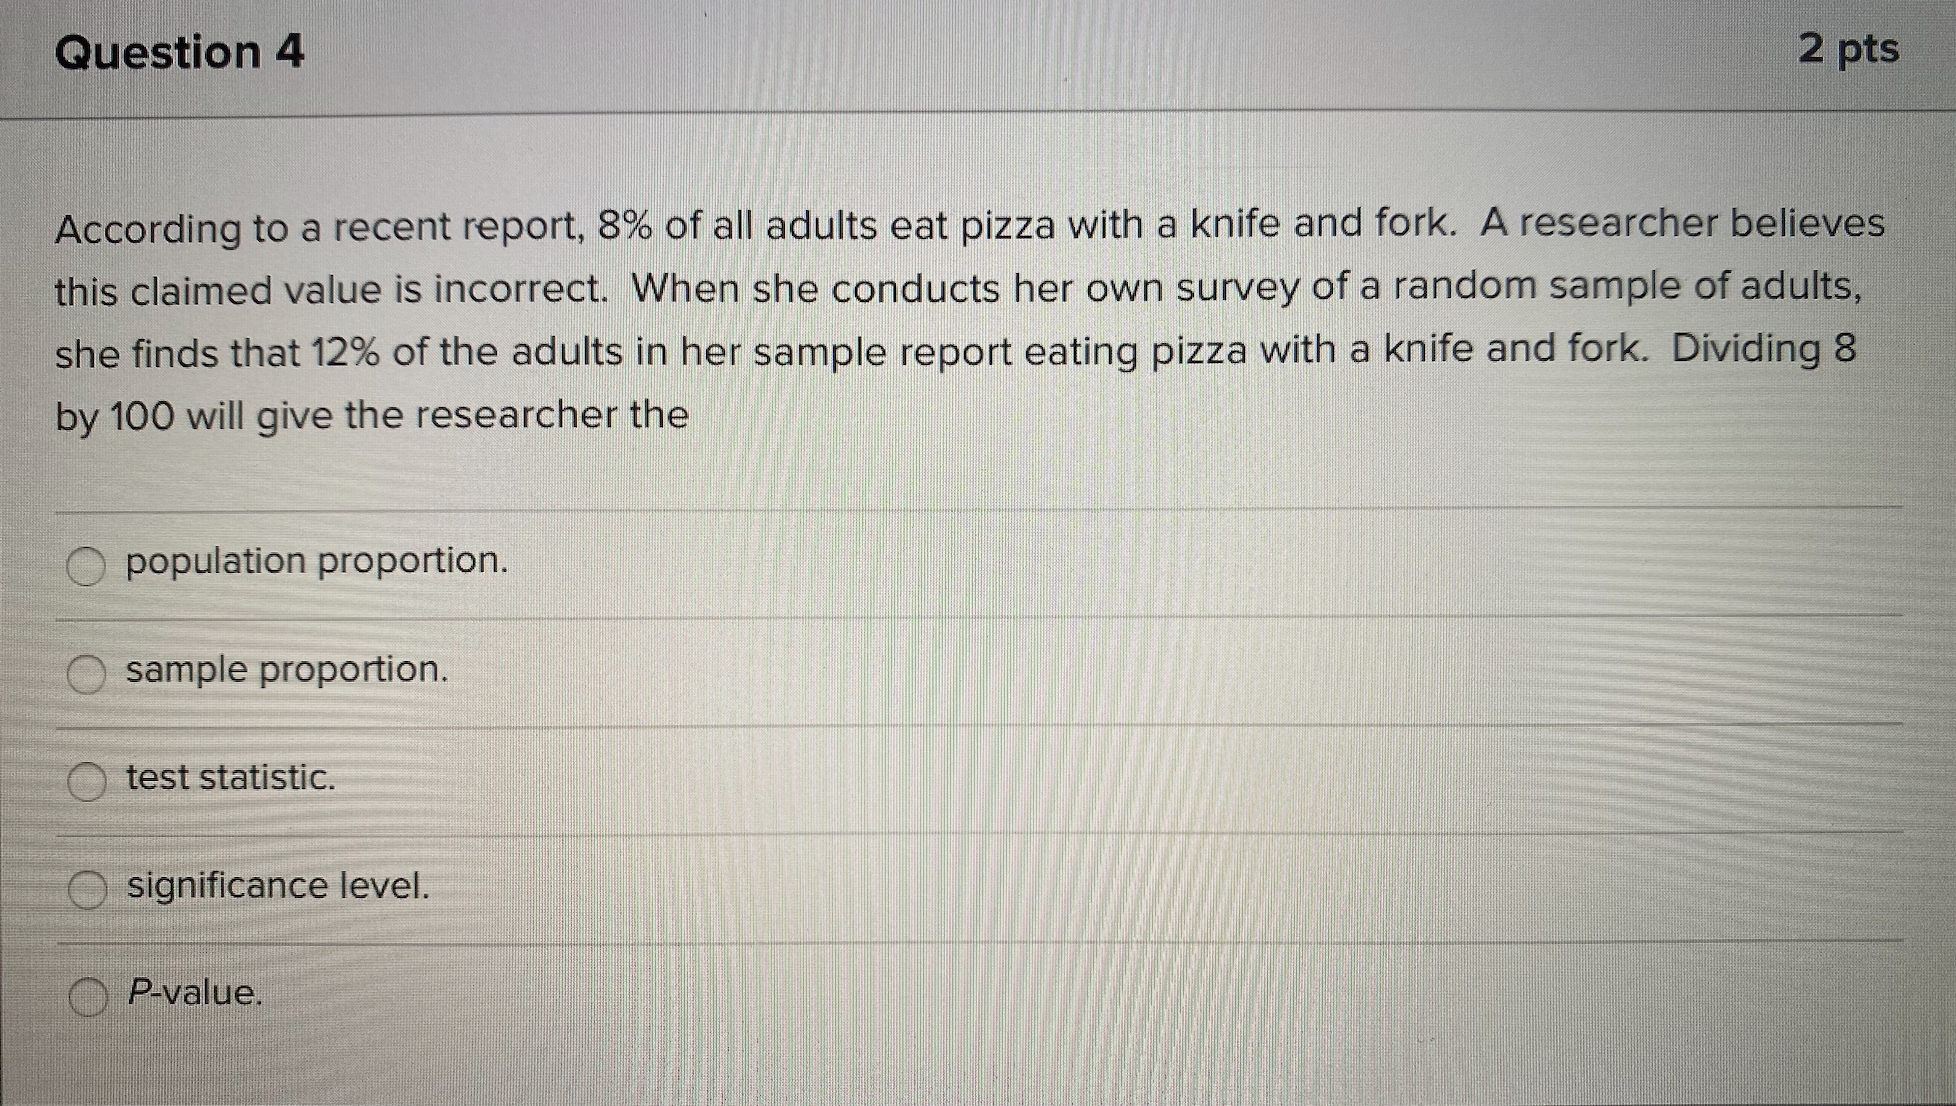
Question 2 2 pts Angela recently discovered that the proportion of cat owners in Scranton, Pennsylvania, is 0.19. Suppose Angela were to select a random sample of n = 200 Scranton residents and determine the proportion within the sample who are cat owners. If this sampling process is repeated many times, we can build a sampling distribution. We know in this case the sampling distribution will be Normal in shape and will have a standard deviation equal to approximately 0.0175 0.0277 0.0314 0.0444 0.0010Question 3 2 Which one of the following statements is false? A sampling distribution is a collection of sample statistics The size of the sample proportion has an impact on the margin of error. O As the sample size gets larger, the standard deviation of the sampling distribution will get smaller. A correlation of -0.70 is weaker than a correlation of +0.70. Chance behavior is predictable in the long run but has an unpredictable pattern in the short run.Question 4 2 pts According to a recent report, 8% of all adults eat pizza with a knife and fork. A researcher believes this claimed value is incorrect. When she conducts her own survey of a random sample of adults, she finds that 12% of the adults in her sample report eating pizza with a knife and fork. Dividing 8 by 100 will give the researcher the population proportion. sample proportion. test statistic. significance level. OP-value.Question 5 2 pts It is claimed that the proportion of high school athletes who go on to play sports in college is 0.08. Believing this claimed value is incorrect, a researcher surveys a random sample of former high school athletes and finds that the proportion who went on to play sports in college is 0.07. When a hypothesis test is conducted at a significance (or alpha) level of 0.05, the P-value is found to be 0.06. What decision should the researcher make based on the results of the hypothesis test? The null hypothesis should be rejected because 0.05 is less than 0.06. The null hypothesis should not be rejected. The null hypothesis should be rejected because 0.06 is less than 0.07. The null hypothesis should be rejected because 0.07 is less than 0.08. The null hypothesis should be rejected because 0.06 is less than 0.08.Question 6 2 pts You have gathered data from a random sample of rollercoasters in order to better understand how the height (in feet) of the rollercoaster relates to the speed (in miles per hour) of the rollercoaster. Your ultimate goal is to construct a regression equation to predict height based on speed. If this is your goal, which variable should you put on the horizontal axis (or x-axis) of a scatterplot of this data? When conducting a regression analysis, it makes no difference which variable is on which axis. OHeight, because it is the response variable. Speed, because it is the response variable. Speed, because it is the explanatory variable. OHeight, because it is the explanatory variable.Question 7 2 pts It has recently been claimed that 47% of adults regularly listen to podcasts. A researcher believes this claimed value is too low. She decides to gather data in order to conduct a hypothesis test, and she writes her alternative hypothesis as "p = 0.47." What is wrong with this? The alternative hypothesis should have an ">" sign rather than the "=" sign. The wrong symbol is being used in the alternative hypothesis; p-hat should be used instead of p. Nothing is wrong. O We cannot determine what might be wrong without knowing what the null hypothesis is. The alternative hypothesis should have a "
Step by Step Solution
There are 3 Steps involved in it
Step: 1
Get Instant Access to Expert-Tailored Solutions
See step-by-step solutions with expert insights and AI powered tools for academic success
Step: 2
Step: 3
Ace Your Homework with AI
Get the answers you need in no time with our AI-driven, step-by-step assistance