

Answered step by step
Verified Expert Solution
Question
1 Approved Answer
Question 2 (20 points). The market supply and demand curves for a product are: Qs-0.5P (supply curve) QD-60-2P (demand curve) where Q is the
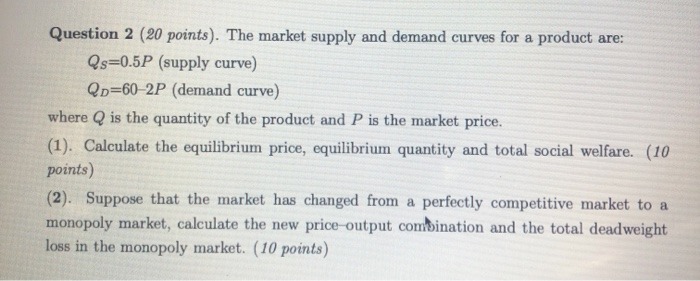
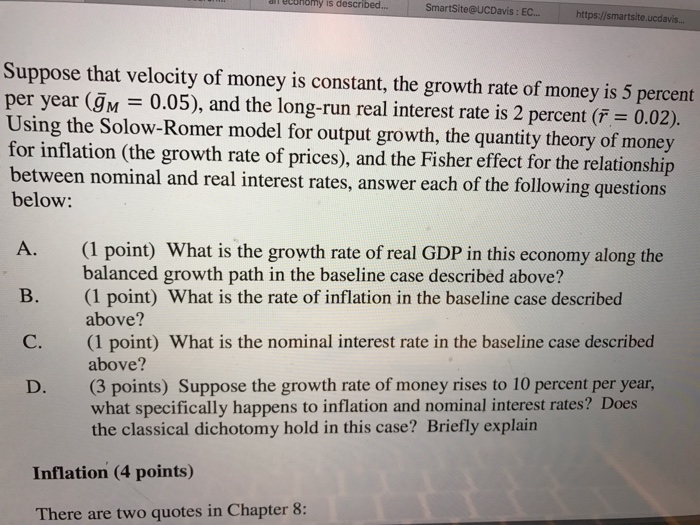
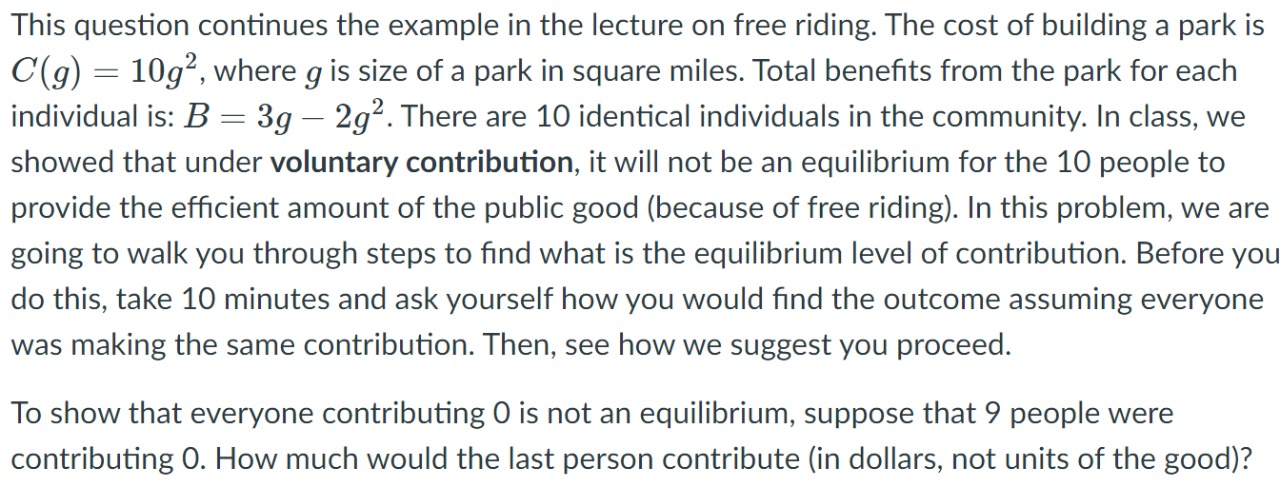
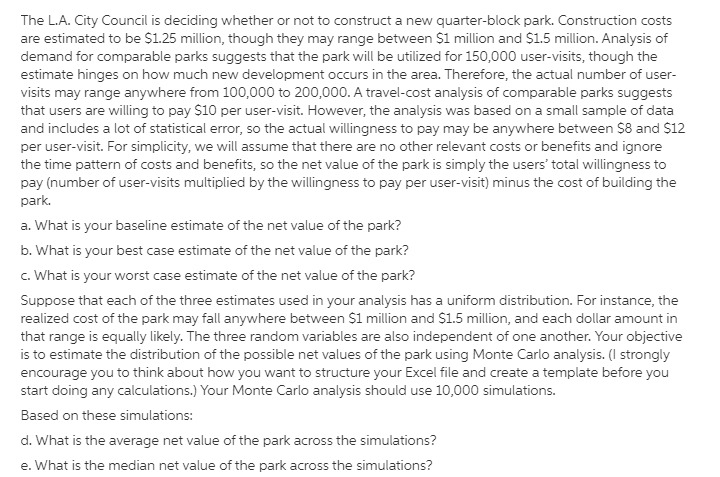
Question 2 (20 points). The market supply and demand curves for a product are: Qs-0.5P (supply curve) QD-60-2P (demand curve) where Q is the quantity of the product and P is the market price. (1). Calculate the equilibrium price, equilibrium quantity and total social welfare. (10 points) (2). Suppose that the market has changed from a perfectly competitive market to a monopoly market, calculate the new price output combination and the total deadweight loss in the monopoly market. (10 points) onomy is described... SmartSite@UCDavis: EC... https://smartsite.ucdavis... Suppose that velocity of money is constant, the growth rate of money is 5 percent per year (M = 0.05), and the long-run real interest rate is 2 percent (r = 0.02). Using the Solow-Romer model for output growth, the quantity theory of money for inflation (the growth rate of prices), and the Fisher effect for the relationship between nominal and real interest rates, answer each of the following questions below: A. B. C. D. (1 point) What is the growth rate of real GDP in this economy along the balanced growth path in the baseline case described above? (1 point) What is the rate of inflation in the baseline case described above? (1 point) What is the nominal interest rate in the baseline case described above? (3 points) Suppose the growth rate of money rises to 10 percent per year, what specifically happens to inflation and nominal interest rates? Does the classical dichotomy hold in this case? Briefly explain Inflation (4 points) There are two quotes in Chapter 8: This question continues the example in the lecture on free riding. The cost of building a park is C(g) = 10g, where g is size of a park in square miles. Total benefits from the park for each individual is: B = 3g - 2g. There are 10 identical individuals in the community. In class, we showed that under voluntary contribution, it will not be an equilibrium for the 10 people to provide the efficient amount of the public good (because of free riding). In this problem, we are going to walk you through steps to find what is the equilibrium level of contribution. Before you do this, take 10 minutes and ask yourself how you would find the outcome assuming everyone was making the same contribution. Then, see how we suggest you proceed. To show that everyone contributing O is not an equilibrium, suppose that 9 people were contributing O. How much would the last person contribute (in dollars, not units of the good)? The L.A. City Council is deciding whether or not to construct a new quarter-block park. Construction costs are estimated to be $1.25 million, though they may range between $1 million and $1.5 million. Analysis of demand for comparable parks suggests that the park will be utilized for 150,000 user-visits, though the estimate hinges on how much new development occurs in the area. Therefore, the actual number of user- visits may range anywhere from 100,000 to 200,000. A travel-cost analysis of comparable parks suggests that users are willing to pay $10 per user-visit. However, the analysis was based on a small sample of data and includes a lot of statistical error, so the actual willingness to pay may be anywhere between $8 and $12 per user-visit. For simplicity, we will assume that there are no other relevant costs or benefits and ignore the time pattern of costs and benefits, so the net value of the park is simply the users' total willingness to pay (number of user-visits multiplied by the willingness to pay per user-visit) minus the cost of building the park. a. What is your baseline estimate of the net value of the park? b. What is your best case estimate of the net value of the park? c. What is your worst case estimate of the net value of the park? Suppose that each of the three estimates used in your analysis has a uniform distribution. For instance, the realized cost of the park may fall anywhere between $1 million and $1.5 million, and each dollar amount in that range is equally likely. The three random variables are also independent of one another. Your objective is to estimate the distribution of the possible net values of the park using Monte Carlo analysis. (I strongly encourage you to think about how you want to structure your Excel file and create a template before you start doing any calculations.) Your Monte Carlo analysis should use 10,000 simulations. Based on these simulations: d. What is the average net value of the park across the simulations? e. What is the median net value of the park across the simulations?
Step by Step Solution
There are 3 Steps involved in it
Step: 1
Here are the answers to the questions with detailed stepbystep calculations A 1 point What is the growth rate of real GDP in this economy along the balanced growth path in the baseline case described ...
Get Instant Access to Expert-Tailored Solutions
See step-by-step solutions with expert insights and AI powered tools for academic success
Step: 2

Step: 3
Ace Your Homework with AI
Get the answers you need in no time with our AI-driven, step-by-step assistance
Get Started
Financial Algebra advanced algebra with financial applications
Authors: Robert K. Gerver
1st edition
978-1285444857, 128544485X, 978-0357229101, 035722910X, 978-0538449670