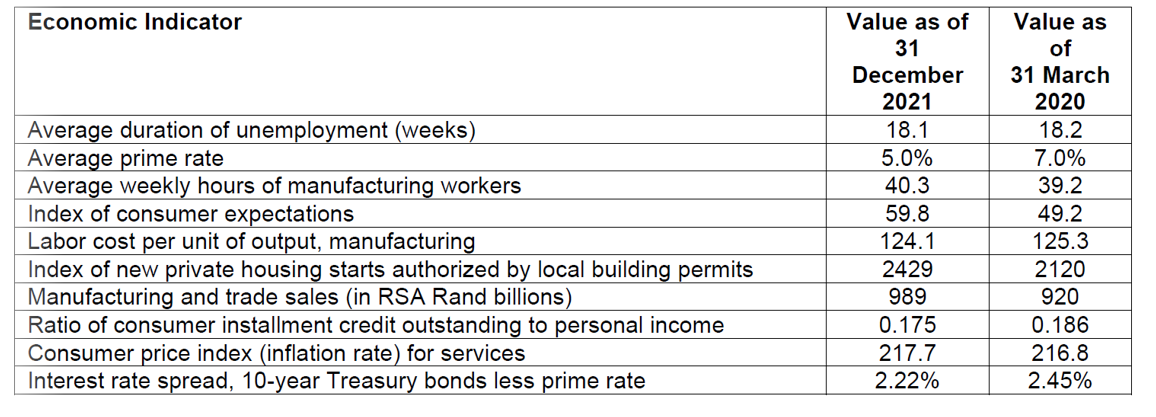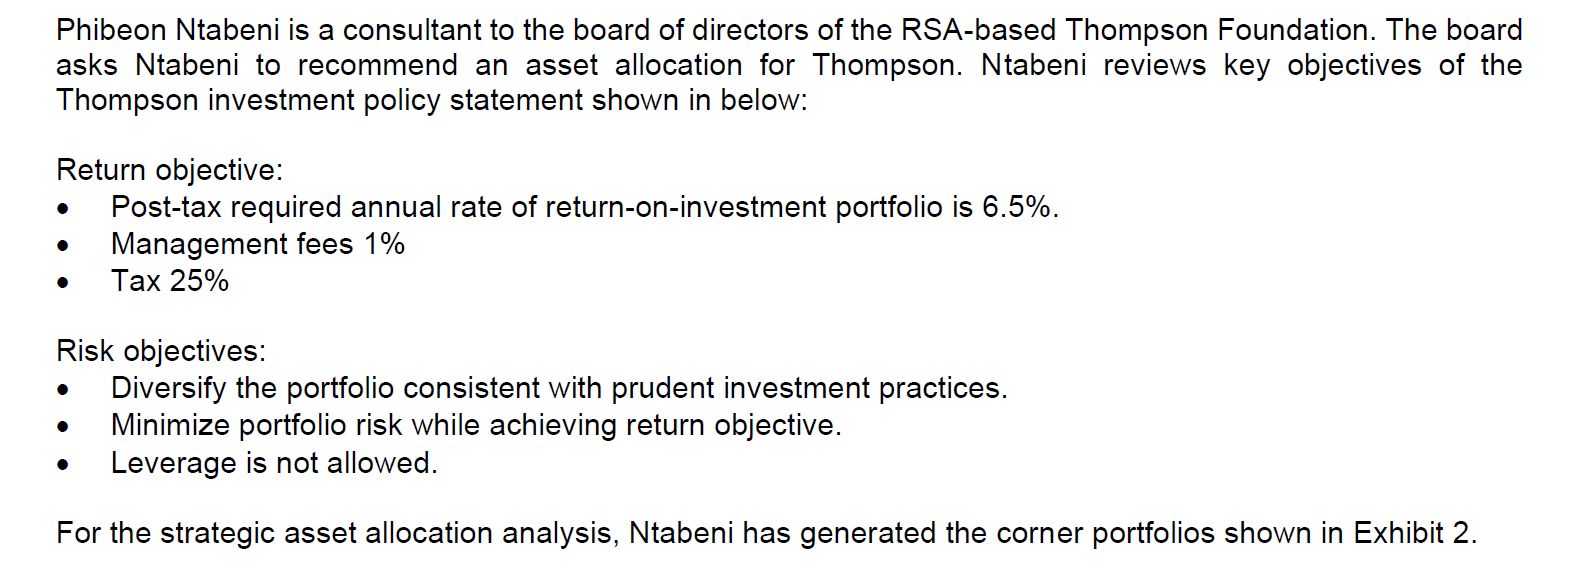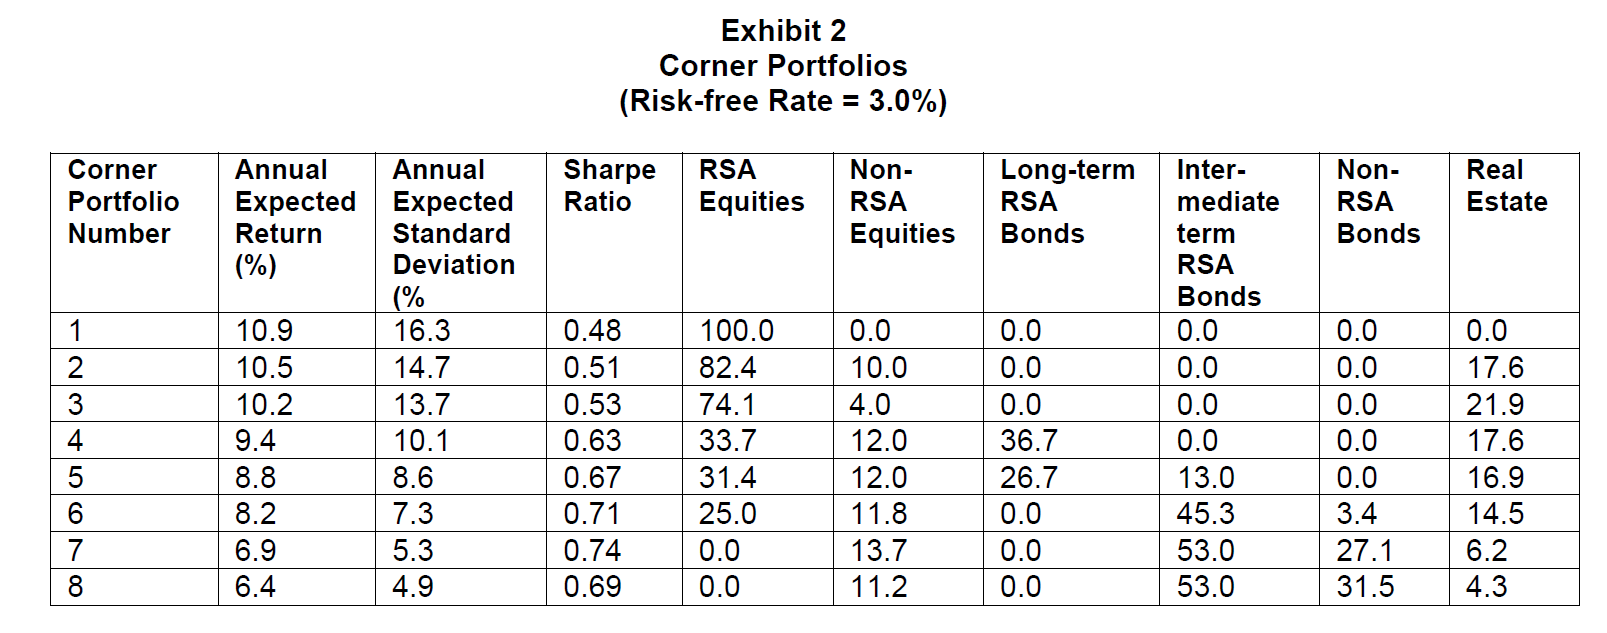


Question 2 [25 marks] Gideon Jariel and Remmy Katemba are analysts at the same firm. Jariel uses the economic indicator approach to formulate his equity market outlook, whereas Katemba uses micro-valuation analysis. Jariel and Katemba have conflicting views on the current outlook for the RSA equity market. Jariel prepares Exhibit 1, a table of recent values of selected RSA economic indicators. He makes the following observation: "Several leading indicators suggest further deterioration in economic conditions. Based on the economic indicator approach, these developments are clearly unfavorable for the RSA equity market. Economic Indicator Average duration of unemployment (weeks) Average prime rate Average weekly hours of manufacturing workers Index of consumer expectations Labor cost per unit of output, manufacturing Index of new private housing starts authorized by local building permits Manufacturing and trade sales (in RSA Rand billions) Ratio of consumer installment credit outstanding to personal income Consumer price index (inflation rate) for services Interest rate spread, 10-year Treasury bonds less prime rate Value as of 31 December 2021 18.1 5.0% 40.3 59.8 124.1 2429 989 0.175 217.7 2.22% Value as of 31 March 2020 18.2 7.0% 39.2 49.2 125.3 2120 920 0.186 216.8 2.45% Phibeon Ntabeni is a consultant to the board of directors of the RSA-based Thompson Foundation. The board asks Ntabeni to recommend an asset allocation for Thompson. Ntabeni reviews key objectives of the Thompson investment policy statement shown in below: Return objective: Post-tax required annual rate of return-on-investment portfolio is 6.5%. Management fees 1% Tax 25% . . Risk objectives: Diversify the portfolio consistent with prudent investment practices. Minimize portfolio risk while achieving return objective. Leverage is no allo ed. . For the strategic asset allocation analysis, Ntabeni has generated the corner portfolios shown in Exhibit 2. Exhibit 2 Corner Portfolios (Risk-free Rate = 3.0%) Corner Portfolio Number Sharpe Ratio RSA Equities Non- RSA Equities Long-term RSA Bonds Non- RSA Bonds Real Estate Annual Annual Expected Expected Return Standard (%) Deviation (% 10.9 16.3 10.5 14.7 10.2 13.7 10.1 8.8 8.6 8.2 7.3 6.9 5.3 6.4 4.9 1 2 3 4 5 6 7 8 9.4 0.48 0.51 0.53 0.63 0.67 0.71 0.74 0.69 100.0 82.4 74.1 33.7 31.4 25.0 0.0 0.0 0.0 10.0 4.0 12.0 12.0 11.8 13.7 11.2 Inter- mediate term RSA Bonds 0.0 0.0 0.0 0.0 13.0 45.3 53.0 53.0 0.0 0.0 0.0 36.7 26.7 0.0 0.0 0.0 0.0 0.0 0.0 0.0 0.0 3.4 27.1 31.5 Oo 0.0 17.6 21.9 17.6 16.9 14.5 6.2 4.3 e) Determine the percentage of portfolio that would be invested in long-term RSA Bonds, based on the most appropriate strategic asset allocation found in part (d). (3) Question 2 [25 marks] Gideon Jariel and Remmy Katemba are analysts at the same firm. Jariel uses the economic indicator approach to formulate his equity market outlook, whereas Katemba uses micro-valuation analysis. Jariel and Katemba have conflicting views on the current outlook for the RSA equity market. Jariel prepares Exhibit 1, a table of recent values of selected RSA economic indicators. He makes the following observation: "Several leading indicators suggest further deterioration in economic conditions. Based on the economic indicator approach, these developments are clearly unfavorable for the RSA equity market. Economic Indicator Average duration of unemployment (weeks) Average prime rate Average weekly hours of manufacturing workers Index of consumer expectations Labor cost per unit of output, manufacturing Index of new private housing starts authorized by local building permits Manufacturing and trade sales (in RSA Rand billions) Ratio of consumer installment credit outstanding to personal income Consumer price index (inflation rate) for services Interest rate spread, 10-year Treasury bonds less prime rate Value as of 31 December 2021 18.1 5.0% 40.3 59.8 124.1 2429 989 0.175 217.7 2.22% Value as of 31 March 2020 18.2 7.0% 39.2 49.2 125.3 2120 920 0.186 216.8 2.45% Phibeon Ntabeni is a consultant to the board of directors of the RSA-based Thompson Foundation. The board asks Ntabeni to recommend an asset allocation for Thompson. Ntabeni reviews key objectives of the Thompson investment policy statement shown in below: Return objective: Post-tax required annual rate of return-on-investment portfolio is 6.5%. Management fees 1% Tax 25% . . Risk objectives: Diversify the portfolio consistent with prudent investment practices. Minimize portfolio risk while achieving return objective. Leverage is no allo ed. . For the strategic asset allocation analysis, Ntabeni has generated the corner portfolios shown in Exhibit 2. Exhibit 2 Corner Portfolios (Risk-free Rate = 3.0%) Corner Portfolio Number Sharpe Ratio RSA Equities Non- RSA Equities Long-term RSA Bonds Non- RSA Bonds Real Estate Annual Annual Expected Expected Return Standard (%) Deviation (% 10.9 16.3 10.5 14.7 10.2 13.7 10.1 8.8 8.6 8.2 7.3 6.9 5.3 6.4 4.9 1 2 3 4 5 6 7 8 9.4 0.48 0.51 0.53 0.63 0.67 0.71 0.74 0.69 100.0 82.4 74.1 33.7 31.4 25.0 0.0 0.0 0.0 10.0 4.0 12.0 12.0 11.8 13.7 11.2 Inter- mediate term RSA Bonds 0.0 0.0 0.0 0.0 13.0 45.3 53.0 53.0 0.0 0.0 0.0 36.7 26.7 0.0 0.0 0.0 0.0 0.0 0.0 0.0 0.0 3.4 27.1 31.5 Oo 0.0 17.6 21.9 17.6 16.9 14.5 6.2 4.3 e) Determine the percentage of portfolio that would be invested in long-term RSA Bonds, based on the most appropriate strategic asset allocation found in part (d). (3)


